Reconstructing Census Data: Innovative Strategies for Disaggregating Demographic Summary Tables
This project explores methodologies to reconstruct original record-level demographics from summary tables. Using agent-based land use forecasting models like UrbanSim, we investigate household location choices and population evolution through microsimulation techniques. Our synthesis strategies focus on minimal guessing and increased data utilization, employing methods like Iterative Proportional Fitting (IPF) and a multi-step synthesis approach. We aim to recreate the master file using available summary tabulations, ensuring compatibility with SF-1 tables while advancing socioeconomic data assimilation.

Reconstructing Census Data: Innovative Strategies for Disaggregating Demographic Summary Tables
E N D
Presentation Transcript
Breaking the Census "Code": Reconstructing Original Record-Level Data from Summary Tables Dmitry Messen Houston-Galveston Area Council
Need for Disaggregate Demographic Data • One person=one record (one household=one record) • Agent-based Land Use Forecasting Model (UrbanSim) • Household Location Choice • Population Evolution Microsimulation • Survival, child birth, migration • Household Evolution Microsimulation • Household formation and dissolution
Synthesis Strategies • Strategy 1: One-step synthesis of all the attributes (N) • Get N separate counts (on each attribute) • Fill in the table margins • Get record-level sample data (PUMS) • Estimate conditional probabilities • Run IPF (Iterative Proportional Fitting) • Fill in the table cells, preserve the margins • Quick results; however, tons of information is not used (wasted)—Spendthrift Synthesis
Synthesis Strategies • Strategy 2: Multi-step synthesis • Guiding principles • Lowest level of spatial resolution • Use all available information • Minimize synthesis • Parsimonious Synthesis
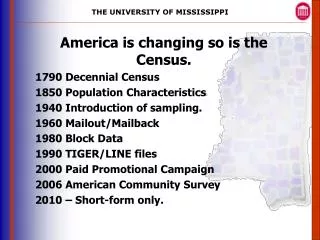
Census Data • Decennial Census • SF-1 Tables • Based on “Short Form” (100% count) • Basic Demographic Info • Age, Sex, Race, Hispanic, Type of Household/Family, Relation to Head of Household • SF-3 Tables • Based on “Long Form” (16% sample) • No Long Form in 2010; ACS • Expanded Socioeconomic Data
Short Form • Based on the “Short Form” responses Census compiles master files of persons and households • All SF-1 Tables are just tabulations from the master file • We can’t see the entire master file, we only have indirect information as revealed by the tabulations • As if the Master File is an encrypted message and we are trying to break the code • MRI/CAT-scan analogy
Master File • Project Goal • To recreate the master file using available summary tabulations • Constraints • Use all available data • Minimize guessing (IPF) • Final product must be fully consistent with SF1 tabulations • Tabulations produced from the reconstructed master file should be identical to SF-1 tables
Expansion Tables • SF-1 Expansion tables (e.g., 16A, 16B, 16I) • 9 categories (A,B,C,..I) • 5 single races, • 1 Other race • 1 Two or more races • 1 Hispanics • 1 White Not Hispanics
Core SF-1 Tables • Tables 27, 28, 30 • Age groups: 0-17, 18-64, 65+ (65-102) • Household Roles—Major Groups: • Householder or Spouse (HS) • Household Head (HH) • Male/Female x Fam/NonFam Alone/NonFam Not Alone • Spouse (SP) • Household Member (HM) • Non-Relative (NR) • Group quarters inhabitant (GQ1, GQ2)
Operational Hierarchy • Rules of Internal Consistency (sudoku puzzle) • No additional info • External Constraints • Race-Hisp Constraint (Tables 5,6,8) • Race-Hisp-Age (Under 18, Over 18) • 0-17 = Under 18,18-65 = Over 18,65-102 = Over 18 • Sex Constraint (Table 12) • Sex-Age • IPF (aka raking, balancing) procedure
Additional Info • Size distribution (1,2,3,4,5,6,7+) for Family and Non-Family Households • By Race of Household Head • Table 26 • Count of MCF and Other Families by Presence (0, at least 1, at least 2) of Children (<18 years old) • By Race of Household Head • Table 35
Phases • Phase 1: Race-Hispanic Assignment • Phase 2: Sex Assignment • Phase 3: Type of Family (married couple or other) Assignment • Phase 4: “Child” Role Assignment • Generate a list of people from the summary table • Phase 5: Match MCF householders with Spouses (PUMS-based probabilities) • Phase 6: Household Size Assignment • Phase 7: Assign People to Households
Implementation • Implemented in SAS • Still experimental • Completed all 7 phases, now reworking the sequence • Stand alone IPF module • Integer solution • 13 counties, 56K+ Blocks, 4.8M+ People
What’s Next • Testing • Documenting • Assigning Socioeconomic (non-SF1) Attributes • Developing Household Evolution Model • Analyzing Census 2010 SF-1 Table shells for compatibility
Thank you! Questions?