Download

1 / 0
10 likes | 201 Vues
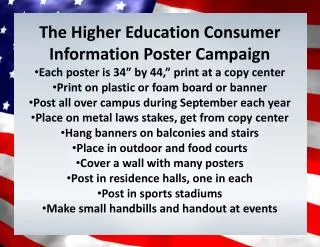
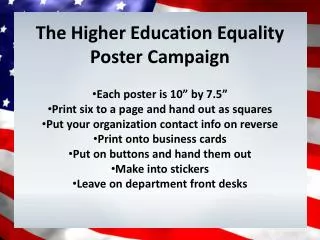
The Higher E ducation Student Debt Poster Campaign Each poster is 34” by 44,” print at a copy center Print on plastic or foam board or banner Post all over campus during September each year Place on metal laws stakes, get from copy center Hang banners on balconies and stairs

E N D


![Poster Name [Align Center]](https://cdn1.slideserve.com/2804700/poster-name-align-center-dt.jpg)