World Population Analysis Using Spreadsheets
Create a spreadsheet showing world population from 1750 till present day with appropriate formatting. Calculate total population and average for each year. Generate charts for Africa, continent data in 1750, and overall continent population growth.

World Population Analysis Using Spreadsheets
E N D
Presentation Transcript
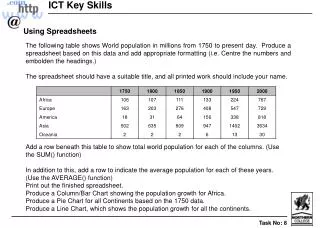
Using Spreadsheets The following table shows World population in millions from 1750 to present day. Produce a spreadsheet based on this data and add appropriate formatting (i.e. Centre the numbers and embolden the headings.) The spreadsheet should have a suitable title, and all printed work should include your name. Add a row beneath this table to show total world population for each of the columns. (Use the SUM() function) In addition to this, add a row to indicate the average population for each of these years. (Use the AVERAGE() function) Print out the finished spreadsheet. Produce a Column/Bar Chart showing the population growth for Africa. Produce a Pie Chart for all Continents based on the 1750 data. Produce a Line Chart, which shows the population growth for all the continents. Task No: 8