Download
1 / 35
350 likes | 497 Vues
Preparation of Sample Hybridization Scanning and Image Analysis. 1. Design experiment. Question? Replicates? Test?. mutant. wild type. 2. Perform experiment. 3. Precipitate RNA. Eukaryote/prokaryote? Cell wall?. 4. Label RNA. Amplification? Direct or indirect? Label?.

E N D
Preparation of Sample Hybridization Scanning and Image Analysis
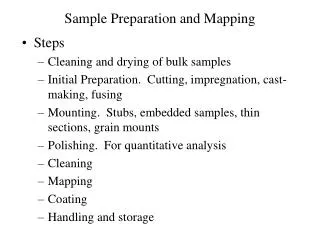
1. Design experiment Question? Replicates? Test? mutant wild type 2. Perform experiment 3. Precipitate RNA Eukaryote/prokaryote? Cell wall? 4. Label RNA Amplification? Direct or indirect? Label? Sample preparation
Sample Preparation - Check quality of RNA Load 50-500 ng of RNA on the BioAnalyzer eukaryotic: 28S/18S ≈ 2.0 prokaryotic: 23S/16S ≈ 2.0
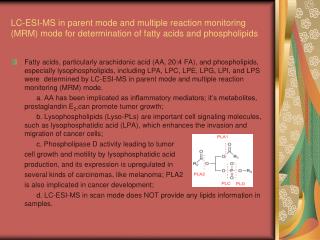
AAAAAAAAA aa-dUTP Sample preparation RNA TTTTTTTTT cDNA • Revese Transcriptase (RT) • oligo dT primer • nucleotides (dNTP) • amino-allyl-dUTP (aa-dUTP)
AAAAAAAAA Sample preparation RNA TTTTTTTTT cDNA • Hydrolysis (NaOH and EDTA Tris) • Clean-up
Sample preparation TTTTTTTTT cDNA • Coupling (Cy3 or Cy5) • Quenching • Clean-up
TTTTTTTTT TTTTTTTTT Sample preparation • Combine • Hybridize
SAMPLE T7 RNA + Reverse Transcriptase ssDNA + RNase H + Polymerase T7 pol + Biotin-labeled nucleotides aRNA Sample Preparation - Eberwine 42 C 2 h 70 C 10 min 16 C 2 h clean up dsDNA dsDNA 37 C 6 h
Detection of Biotin (Affymetrix) Streptavidin Phycoerythrim = SAPE ( ) anti-SAPE IgG biotinylated anti-anti IgG
Materials and Methods All protocols can be found here: http://cmgm.stanford.edu/pbrown and here: http://www.affymetrix.com
by H. Bjørn Nielsen Scanning and image analysis • Scanning • -Dyes • -Confocal scanner • -CCD scanner • Image File Formats • Image analysis • -Locating the spots • -Segmentation • -Evaluating data quality
Hybridization Probe length
Scanning Images Microarray technology Washing
Labeling dyes and their properties The two most common fluorochromes used are: Cyanine3 (cy3, exicitation = 554, emission = 568) Cyanine5 (cy5, exicitation = 650, emission = 672) But Alexa dyes are also becoming popular Excitation Emission Flourescence
Excitation Emission Excitation Emission Cyanine Dye spectra excitation and emission
Alexa Dyes comparison of excitation spectra
Confocal scanner diagram
The confocal scanner scans the slide
CCD scanner detects from an area CCD camera Emission filter White light Beamsplitter Excitation filter
Microarray image formats • The most common file format is 16bit TIFF. • A 16bit TIFF file describe each pixel in an image with an intensity ranging from 0-65535 • The image resolution is commonly 10m [currently, max 5m] • Normally two scans in different wavelengths result in two monochrome files that are overlaid Pseudo-color overlay Cy 3 Channel Cy 5 Channel
Density Intensity overview Image analysis Locating the spots Segmentation Ensuring good data quality (flagging)
Locating the spot features A grid is laid over the image to aid the program in identifying the individual spots Most programs have some automation in this step.
Density Intensity Spot Segmentation Overview
Fixed Circle segmentation • Fits a circle with a constant diameter to all spots in the image • Easy to implement • The spots need to be of the same shape and size
Adaptive Circle segmentation The circle diameter is estimated separately for each spot Problematic if spot exhibits non-circular shapes
Adaptive Shape segmentation Starts by Specifying a starting points (given by the gridding) Regions grow outwards from the starting point according to the difference between a pixel’s value and the running mean of values in an adjoining region.
Density Intensity Histogram segmentation • Uses a target mask chosen to be larger than any spot • Foreground and background intensity are determined from the histogram of pixel values for pixels within the masked area • Example : • Background : mean between 5th and 20th percentile • Foreground : mean between 80th and 95th percentile
Background Estimation Spot ScanAlyze QuantArray examples
Spot Irregularity examples Some spots may be more uncertain than others. This can be caused by: -Dust grains -Background smear -Strange shaped spot (comet tails, etc.) -Donuts shaped spots -Weak signals
Quality Measures examples • We can pickup most of these irregularities by these measures • - Intensity variability measures • - Spot size deviation • - Circularity deviation • - Relative signal to background intensity • - Position deviates from a rectangular grid • Based on such measurements, a spot can • be rejected
Feature Intensity calculation The average or median pixel value in the spot and background masks are calculated.
Output Example (ImaGene) Field Meta Row Meta Column Row Column Gene_ID Flag Signal MeanBackgroundMean A 1 1 1 2 ZY030076 0 4655 463 A 1 1 1 3 ZY030066 0 15938 405 A 1 1 1 4 ZY029209 0 7441 390 A 1 1 1 5 ZY030089 0 1842 399 A 1 1 1 6 ZY030084 0 6864 401 A 1 1 1 7 ZY007003 2 471 481 A 1 1 1 8 ZY006869 0 8576 447 A 1 1 1 9 ZY007954 0 4965 405 A 1 1 1 10 ZY006866 0 2236 374 A 1 1 1 11 ZY006782 0 2088 355 A 1 1 1 12 ZY006907 0 4726 342 A 1 1 1 13 ZY006593 0 4437 338 A 1 1 1 14 ZY006850 0 917 321
Examples of Difficult Images microarray images
Book about hybridization Nucleic Acid Hybridization (Introduction to Biotechniques S.) By: M.L.M. Anderson Paperback 256 pages (December 1998) Publisher: BIOS Scientific Publishers ISBN: 1859960073