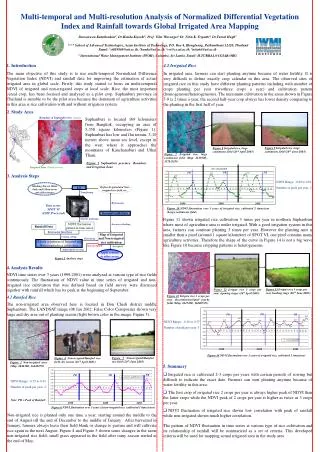
Global Impacts of Climate Change on Water Storage Capacity
Investigating the impact of climate change on snowpack storage and reservoir capacity globally. Identifying regions at risk due to reduced snowpack and limitations of existing reservoirs. Study uses historical and future data to predict changes in water resources.

Global Impacts of Climate Change on Water Storage Capacity
E N D
Presentation Transcript
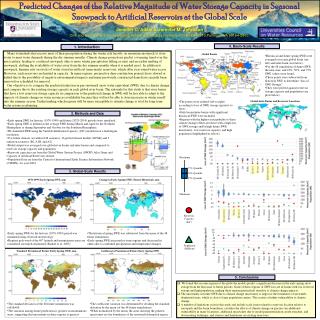
Predicted Changes of the Relative Magnitude of Water Storage Capacity in Seasonal Snowpack to Artificial Reservoirs at the Global Scale Jennifer C. Adam & Jennifer M. Johnston Civil and Environmental Engineering, Washington State University, PO Box 642910,Pullman, WA 99164-2910. 4. Basin-Scale Results 1. Introduction Many watersheds that receive most of their precipitation during the winter rely heavily on mountain snowpack to store water to meet water demands during the dry summer months. Climate change projections predict a warming trend over the next century, leading to a reduced snowpack (due to more winter precipitation falling as rain) and an earlier melting of snowpack, shifting the availability of water away from the dry summer months when it is needed most. In addition to snowpack, humans rely on stocks of water stored in artificial (man-made) reservoirs, which offer year-round water access. However, such reservoirs are limited in capacity. In many regions, prospective dam construction projects have slowed or halted due to the possibility of negative environmental impacts and many previously constructed dams have recently been removed or scheduled for removal. Our objective is to compare the predicted reduction in pre-snowmelt snow water equivalent (SWE) due to climate change and compare this to the existing storage capacity in each global river basin. The rationale for this study is that river basins that have a low reservoir storage capacity in comparison to the predicted change in SWE will be less able to adapt to the impacts of climate change on water resources availability because they will not be able to store increases in winter runoff into the summer season. Understanding which regions will be more susceptible to climate change is vital for long-term water resources planning. Global Basins • Historical and future spring SWE were averaged over each global basin (see left) and inter-basin (see below). • For the 48 simulations of future SWE, the min, max, and 25%, 50%, and 75% SWE values were found. • These points were subtracted from historical SWE to determine “loss of SWE Storage”. • They were plotted against reservoir storage capacity and population (see plots below). Global Inter-Basins and Reservoir Locations • The points were ordered (left to right) according to loss of SWE storage (greatest to least). • Only basins/inter-basins with significant historical SWE were included. • Regions with the highest susceptibility to these climate change effects are those with a high loss of SWE storage and/or high future SWE uncertainty, low reservoir capacity, and high population (highlighted in yellow). 2. Methods and Data • Early spring SWE for historic (1970-1999) and future (2025-2054) periods were simulated. • Early spring SWE is defined as the average SWE during March and April for the Northern Hemisphere or during September and October for the Southern Hemisphere. • We simulated SWE using the Variable Infiltration Capacity (VIC) model run at a half degree resolution. • For future climate, we utilized 48 scenarios: 16 global climate models (GCMs) and 3 emission scenarios (B1, A1B, and A2). • Model output was averaged over global river basins and inter-basins and compared to reservoir storage capacity and population. • Reservoir capacities are from the Global Water System Project (GWSP) Atlas Dams and Capacity of Artificial Reservoirs dataset. • Population Data are from the Center for International Earth Science Information Network (CIESIN), for year 2004. Maximum 75% Quantile 3. Global-Scale Results 50% Quantile 25% Quantile 1970-1999 Early Spring SWE, mm Change in Early Spring SWE (Future-Historical), mm 15 10 5 0 Minimum -5 -10 -15 Reservoir Capacity (km3) 20 10 0 • Early spring SWE for the historic (1970-1999) period was simulated using observed meteorology. • Regions pole-ward of the 40° latitude and mountainous areas are considered snowmelt-dominated (Barnett et al. 2005). • The historical spring SWE was subtracted from the mean of the 48 future simulations. • Early spring SWE increased in some regions and decreased in others due to combined precipitation and temperature changes. -10 -20 -30 -40 -50 Population (Millions) -60 Standard Deviation of Future Early Spring SWE, mm Coefficient of Variation of Future Early Spring SWE 5. Conclusions • We found that in some regions of the globe the models predict a significant decrease in the early spring snow storage from the historical to future periods. Some of these regions of SWE loss are in basins with low reservoir storage and high population, making these regions particularly sensitive to climate change impacts. • The uncertainty in future SWE due to climate change uncertainty is largest at the boundaries of snowmelt-dominated areas, which is close to large population centers. This creates a further vulnerability to climate change. • A number of limitations exist in this study and include scale issues related to reservoir location relative to snowpack and the basin boundaries, excludes the effects of climate change on glaciers (an additional vulnerability in many locations), additional uncertainty due to model parameterization, mode structure, and downscaling technique, and stresses and limitations on existing reservoirs. • The standard deviation of the 48 future simulations was calculated. • The variation among future predictions is greatest in mountainous areas, suggesting that uncertainty in these regions is greatest. • The coefficient variation was determined by dividing the standard deviation by the mean (of the 48 future simulations). • When normalized by the mean, the areas showing the greatest uncertainty are the boundaries of the snowmelt-dominated region.