Download
1 / 15
160 likes | 295 Vues
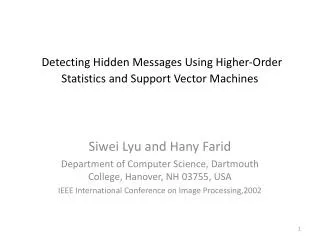
Detecting Hidden Messages Using Higher-Order Statistics and Support Vector Machines. Siwei Lyu and Hany Farid Department of Computer Science, Dartmouth College, Hanover, NH 03755, USA IEEE International Conference on Image Processing,2002 . Outline. Introduction Image Statistics

E N D
Detecting Hidden Messages Using Higher-OrderStatistics and Support Vector Machines SiweiLyu and HanyFarid Department of Computer Science, Dartmouth College, Hanover, NH 03755, USA IEEE International Conference on Image Processing,2002
Outline • Introduction • Image Statistics • Classification • Results • Conclusion • References
Introduction • Although the presence of embedded messages is often imperceptible to the human eye, it may nevertheless disturb the statistics of an image. • The embedding of a message significantly alters these statistics and thus becomes detectable. Support vector machines (linear and non-linear) are employed to detect these statistical deviations.
Image Statistics • The decomposition employed here is based on separable quadrature mirror filters (QMFs)
Image Statistics • This is accomplished by applying separable lowpass and highpass filters along the image axes generating a vertical, horizontal, diagonal and lowpasssubband.
Image Statistics • The vertical, horizontal, and diagonal sub bands at scale i = 1, ..., n are denoted as Vi(x, y), Hi(x,y), and Di(x,y), respectively
Image Statistics • The second set of statistics is based on the errors in an optimal linear predictor of coefficient magnitude
Image Statistics • Where denotes scalar weighting values. This linear relationship is expressed more compactly in matrix form as The coefficients are determined by minimizing the quadratic error function:
Image Statistics • This error function is minimized by differentiating with respect to W: • Setting the result equal to zero, and solving for w to yield:
The log error in the linear predictor is then given by: • It is from this error that additional statistics are collected, namely the mean, variance, skewness and kurtosis.
Classification • Linear Separable SVM • Linear Non-Separable SVM
Classification • Non-Linear SVM
Results • Use 640*480 pixel, message consists of a n*n pixel n= {32,64,128,256} ,pixel range [0,255].
Conclusion • These higher-order statistics appear to capture certain properties of “natural" images, and more importantly ,these statistics are significantly altered when a message is embedded within an image. • To avoid detection, of course, one need only embed a small enough message that does not significantly disturb the image statistics.
References • H. Farid. Detecting hidden messages using higher-order statistical models. In International Conference on Image Processing, page (to appear), Rochester, New York, 2002. • M. Vetterli. A theory of multirate filter banks. IEEE Transactions on ASSP,