Download
1 / 35
430 likes | 837 Vues
Biomedical Imaging I. Class 8 – Ultrasound Imaging II: Instrumentation and Applications 11/02/05. Generation and Detection of Ultrasound. Piezoelectric effect I.

E N D
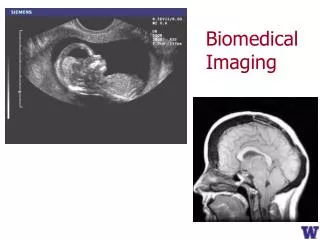
Biomedical Imaging I Class 8 – Ultrasound Imaging II: Instrumentation and Applications 11/02/05
Piezoelectric effect I • Conversion of electric energy into mechanical energy and vice versa in materials with intrinsic el. dipole moments (structural anisotropy). • Electric field (~100 V) causes re-orientation of dipoles deformation • Deformation causes shift of dipoles induces Voltage • Examples of piezoelectric Materials: • Crystalline (quartz), Polycrystalline ceramic (PZT, lead zirconium titanate), Polymers (PVDF) Crystalline: Quartz (SiO2)
Piezoelectric effect II “a phase” (not p.e. active) “b phase” (p.e. active) Polycrystalline (e.g., ferroelectric, PZT) Polymers (PVDF)
Dflo-Q Amplitude A (fres) = 0 dB - 3 dB Dfhi-Q Frequency Transducer Q-factor • Disc of piezoelectric material (usually PZT) shows mechanical resonance frequencies fres Resonance curve (Q-factor) • High Q: strong resonance(narrow curve) • Low Q: strongly damped, weak resonance (broad curve) • Tradeoff of high Q: • Efficient at fres (high signal-to-noise ratio) • Pulse distortion
Transducer resonances • Transducer (disc) has mechanical resonances at frequencies • Lowest (fundamental) resonance frequency (standing wave): (c: speed of sound, : wavelength) Transducer ends have 180 phase difference (= = /2) time Crystal Length of crystal, Lc
Transducer backing • Backing of transducer with impedance-matched, absorbing material reduces reflections from back damping of resonance • Reduces efficiency • Increases Bandwidth (lowers Q)
Transducer–tissue mismatch • Impedance mismatch causes reflection, inefficient coupling of acoustical energy from transducer into tissue: ZT 30 MRaylZL 1.5 MRayl It/Ii = 0.18 • Solution: Matching layer(s) • increases coupling efficiency • damps crystal oscillations, increases bandwidth (reduces efficiency) ZL ZT Load (tissue) Transducer Ii It Ir
Matching layers ZL • A layer between transducer and tissue with ZT>Zl>ZLcreates stepwise transition • Ideally, 100 % coupling efficiency across a matching layer is possible because of destructive interference of back reflections if • layer thickness =/4 • Zl chosen so that Ir,1=Ir,2 : • Problems: Finding material with exact Zl value (~6.7 MRayl) • Dual-layer: Zl ZT MatchingLayer Load (Target) Transducer It Ii Ir,1 It,L Ir,l Ir,2 = /4 = /2
Pulsed vs. C.W. mode • Low bandwidth: • No backing, matching possible • High efficiency (SNR) • High-Q • Strong “Pulse ringing” c.w. applications • Large Bandwidth: • Pulsed applications • Backing, matching • Low-Q • Lowered efficiency
Axial beam profile • Piston source: Oscillations of axial pressure in near-field (e.g. z0= (1 mm)2/0.3mm = 3 mm) • Caused by superposition of point wave sources across transducer (Huygens’ principle) Function, see Webb Eq. (3.30)
Lateral beam profile • Determined by Fraunhofer diffraction in the far field. • Given by Fourier Transform of the aperture function • Lateral resolution is defined by width of first lobe (angle of fist zero) in diffraction pattern • For slit (width a): • For disc (radius r, piston source):
Axial and lateral resolution • Axial resolution = 0.5t c, determined by spatial pulse length (t = pulse duration). Pulse length determined by location of -3 dB point. • Lateral resolution determined by beam width (-3 dB beam width or - 6 dB width)
Focusing of ultrasound • Increased spatial resolution at specific depth • Self-focusing radiator or acoustic lens
Transducer arrays • Linear sequential array lateral scan • Linear phased array for beam steering, focusing
Array types • Linear Sequential (switched) ~1 cm 10-15 cm, up to 512 elements • Curvilinearsimilar to (a), wider field of view • Linear Phasedup to 128 elements, small footprint cardiac imaging • 1.5D Array3-9 elements in elevation allow for focusing • 2D PhasedFocusing, steering in both dimensions
Array resolution • Lateral resolutiondetermined by width of main lobe according to Larger array dimension increased resolution • Side lobes (“grating lobes”) reduce resolution and appear at g a w
Radiation pattern • Contributions of different terms to pattern: Example for: a = l g = 2 l w = 32 l w a g
A-mode (amplitude mode) I • Oldest, simplest type • Display of the envelope of pulse-echoes vs. time, depth d = ct/2 • Pulse repetition rate ~ kHz (limited by penetration depth, c 1.5 mm/s 20 cm 270 s, plus additional wait time for reverberation and echoes)
A-mode II • Frequencies: 2-5 MHz for abdominal, cardiac, brain; 5-15 MHz for ophthalmology, pediatrics, peripheral blood vessels • Applications: ophthalmology (eye length, tumors), localization of brain midline, liver cirrhosis, myocardium infarction • Logarithmic compression of echo amplitude (dynamic range of 70-80 dB) Time-Gain Compensation Logarithmic compression of signals
M-mode (“motion mode”) • Recording of variation in A scan over time • Cardiac imaging: wall thickness, valve function see Fig. 3.17
M-mode clinical example • B-Mode / M-Mode image of mitral valve
B-mode (“brightness mode”) • Lateral scan across tissue surface • Grayscale representation of echo amplitude
Real-time B scanners • Frame rate Rf ~30 Hz: • Mechanical scan: Rocking or rotating transducer + no side lobes - mechanical action, motion artifacts • Linear switched array d: depth N: no. of lines
Frequency Counter SpectrumAnalyzer CW Doppler • Doppler shift in detected frequency • Separate transmitter and receiver • Bandpass- filtering of Doppler signal: • Clutter (Doppler signal from slow-moving tissue, mainly vessel walls) @ f<1 kHz • LF (1/f) noise • Blood flow signal @f < 15 kHz • CW Doppler bears no depth information v: blood flow velocityc: speed of sound: angle between direction of blood flow and US beam
v [10cm/s] t [0.2 s] CW Doppler clinical images • CW ultrasonic flowmeter measurement (radial artery) • Spectrasonogram: Time-variation of Doppler Spectrum f t
Pulsed Doppler – single volume • Time gate (range gate) is used to define depth location • Sample volume ~mm2 • Center or carrier frequency 2-10 Mhz • Pulse repetition rate 1/T~ kHz • Red Box? • Demodulation of signal, see Webb, pp.138
Duplex Imaging • Combines real-time B-scan with US Doppler flowmetry • B-Scan: linear or sector • Doppler: C.W. or pulsed (fc = 2-5 MHz) • Duplex Mode: • Interlaced B-scan and color encoded Doppler images limits acquisition rate to 2 kHz (freezing of B-scan image possible) • Variation of depth window (delay) allows 2D mapping (4-18 pulses per volume)
Duplex imaging example (c.w.) www.medical.philips.com