Download
1 / 33
330 likes | 368 Vues
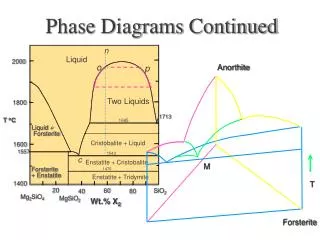
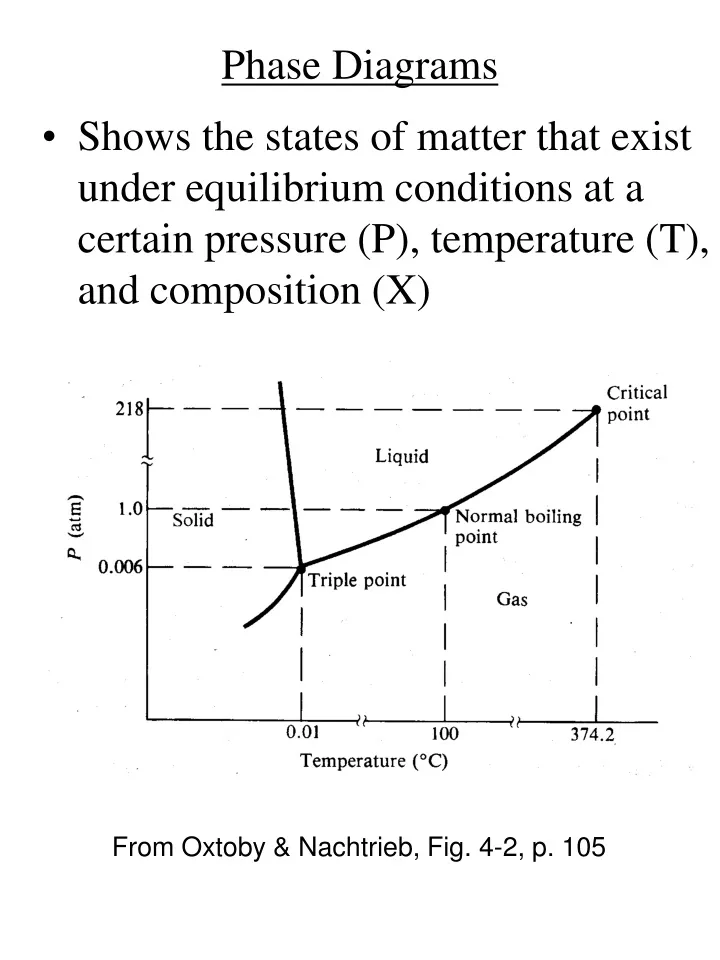
Phase Diagrams. Shows the states of matter that exist under equilibrium conditions at a certain pressure (P), temperature (T), and composition (X). From Oxtoby & Nachtrieb, Fig. 4-2, p. 105. Phase Diagrams. States of matter : Solid Liquid Gas Different crystalline forms

E N D
Phase Diagrams • Shows the states of matter that exist under equilibrium conditions at a certain pressure (P), temperature (T), and composition (X) From Oxtoby & Nachtrieb, Fig. 4-2, p. 105
Phase Diagrams • States of matter : • Solid • Liquid • Gas • Different crystalline forms • e.g., Ga has orthorhombic crystal structure (g) • As has rhombohedral crystal structure (a) • Ga0.5As0.5 has zincblende crystal structure (c)
Phase Diagrams • The lines in a phase diagram indicate an equilibrium (coexistence) between two phases (DG = 0) • XS ↔ XL (solid-liquid equilibrium) • ↔ b (crystal structure transformations) From Oxtoby & Nachtrieb, Fig. 4-2, p. 105
Two-Component Phase Diagrams • One-component phase diagram is a 2-D plot of T (x-axis) versus P (y-axis) • For two components, phase diagram is a 3-D plot of T, P, and X; usually plot X (x-axis) versus T (y-axis) with P fixed • Caution: P for phase diagrams is usually fixed at 1 atm (STP); but MBE occurs a lower pressures • (< 10-3 Torr)
Alloy Solutions • e.g., SixGe1-x • In1-xGaxAs From Porter & Easterling, Fig. 1.7, p. 12 • G = xAGA + xBGB + DGmix
Alloy Solutions • G = xAGA + xBGB + DGmix DGmix = DHmix – TDSmix Three types of solid solutions: Perfect Ideal Regular DHmix = 0 DSmix = 0 DHmix = 0 DSmix > 0 DHmix > 0 DSmix > 0
Perfect Solutions • G = xAGA + xBGB • DHmix = 0 • DSmix = 0 • e.g., a gas mixture where atoms do not interact (ideal gas) From Porter & Easterling, Fig. 1.8, p. 13
Ideal Solutions • Atoms are chemically similar and occupy similar lattice sites, e.g., SixGe1-x (DHmix ~ 0) • Boltzmann equation: DSmix = R ln w (configurational entropy) • w = # distinguishable ways of arranging atoms in the solution From Porter & Easterling, Fig. 1.7, p. 12
Ideal Solutions • w = (NA + NB)! / NA! NB! • DSmix = R ln w • = - R (XAlnXA + XBlnXB) • XA, XB < 1 therefore DSmix > 0
Ideal Solutions • G = xAGA + xBGB + DGmix • = xAGA + xBGB+ RT (XAlnXA + XBlnXB) From Porter & Easterling, Fig. 1.12, p. 15
Ideal Solutions • The state with the lowest G will be the stable phase From Porter & Easterling, Fig. 1.29, p. 34
Total Gibbs Free Energy G GS GL GL+S A Xo XS XL B • Two phases with composition XS and XL have a total G given by GL+S • Two phases (L+S) with composition XS and XL have lower G than either phase alone Reference: D.A. Porter and K.E. Easterling, “Phase Transformation in Metals and Alloys” (Chapman & Hall, 2nd edition, 1992)
Common Tangent Construction G GS GL GL+S A XL B XS Xo • The lowest G is achieved by separating into L + S with compositions defined by the tangent points on the curves GS and GL
Lever Rule • The lever rule indicates the relative phase amounts: • % Liquid = (XS – Xo) / (XS – XL) x 100 • % Solid = (Xo – XL) / (XS – XL) x 100 G GS GL GL+S A XL B XS Xo
Ideal Solutions • The state with the lowest G will be the stable phase From Porter & Easterling, Fig. 1.29, p. 34
Liquid Phase Epitaxy (LPE) • If a liquid with composition Xo is lowered in temperature from A to B then liquid will form with composition XL and solid with composition XS A B From Ohring, Fig. 1-12, p. 28
Lever Rule • The lever rule indicates the relative phase amounts that are formed: • % Liquid = (XS – Xo) / (XS – XL) x 100 • % Solid = (Xo – XL) / (XS – XL) x 100 A B From Ohring, Fig. 1-12, p. 28
Ideal Solutions • Phase diagrams for SixGe1-x at typical MBE conditions From Tsao, Fig. 3.4, p. 60
MBE Growth • If a vapor with composition Xo is lowered in temperature from A to B then crystal will form with composition Xc and vapor with composition Xv A B Ge Xo Si Xc Xv X From Tsao, Fig. 3.4, p. 60
Lever Rule • The lever rule indicates the relative phase amounts: • % V = (Xc – Xo) / (Xc – Xv) x 100 • % C = (Xo – Xv) / (Xc – Xv) x 100 A B Ge Xo Si Xc Xv X From Tsao, Fig. 3.4, p. 60
Regular Solutions Three types of solid solutions: Perfect Ideal Regular DHmix = 0 DSmix = 0 DHmix = 0 DSmix > 0 DHmix > 0 DSmix > 0
Regular Solutionse.g., Stoichiometric Compounds • e.g., Ga + As GaAs • Ga has orthorhombic crystal structure (g) • As has rhombohedral crystal structure (a) • Ga0.5As0.5 has zincblende crystal structure (c) • 7 phases: solid Ga, solid As, solid GaAs, liquid As, liquid Ga, vapor Ga, vapor As2
Stoichiometric Compounds Regular Solutions: DHmix > 0 From Tsao, Fig. 3.8, p. 73
MBE Window • MBE window is indicated by shaded region As Ga xc From Tsao, Fig. 3.8, p. 73
MBE window is bounded on the left by Ga-rich liquid plus GaAs compound 2-phase region • Need As-rich vapor to prevent liquid Ga formation (xo > 0.5) MBE Window From Tsao, Fig. 3.8, p. 73 A B As Ga xv xc xo
MBE Window • MBE window is bounded on the bottom by a GaAs compound plus As-rich crystal 2-phase region • Need Tsubstrate > 600 K A B As Ga xv xc xo From Tsao, Fig. 3.8, p. 73
MBE Window • Otherwise, excess As condenses into rhombohedral crystal structure, <As>a • Low-temperature MBE From Tsao, Fig. 3.10, p. 76
MBE Window • MBE window is bounded on the top by Ga-rich liquid plus As-rich vapor 2-phase region • Need Tsubstrate < 1000 K A B As Ga xv xc xo From Tsao, Fig. 3.8, p. 73
MBE Window • Otherwise GaAs will decompose into Ga liquid and As2 vapor From Tsao, Fig. 3.9, p. 75
Binary AlloysRegular Solutions G = xAGA + xBGB + DGmix DGmix = DHmix –TDSmix From Porter & Easterling, Fig. 1.15(c) & (d), p. 20
Binary Alloys • e.g., mixture of InAs and GaAs to form In1-xGaxAs • lattice constants: aInAs = 6.0584 Å, aGaAs = 5.6533 Å • DHmix > 0 due to the bond bending and stretching from equilibrium positions • Randomly mixed solution is thermodynamically unstable • InAs and GaAs bonds are preferred compared to average InGaAs bonds • G is lowered by phase separating into InAs-rich and GaAs-rich regions From Porter & Easterling, Fig. 1.18(a) & (b), p. 23
Phase Separation LaPierre, Ph.D. thesis
Miscibility Gap • Spinodal isotherms for III-V alloys From Panish & Temkin, Fig. 2.12, p. 31