Download
1 / 32
320 likes | 325 Vues
Learn about the principles, instrumentation, and applications of NMR spectroscopy in organic chemistry. Understand the important factors governing chemical shifts and the interpretation of NMR spectra.

E N D
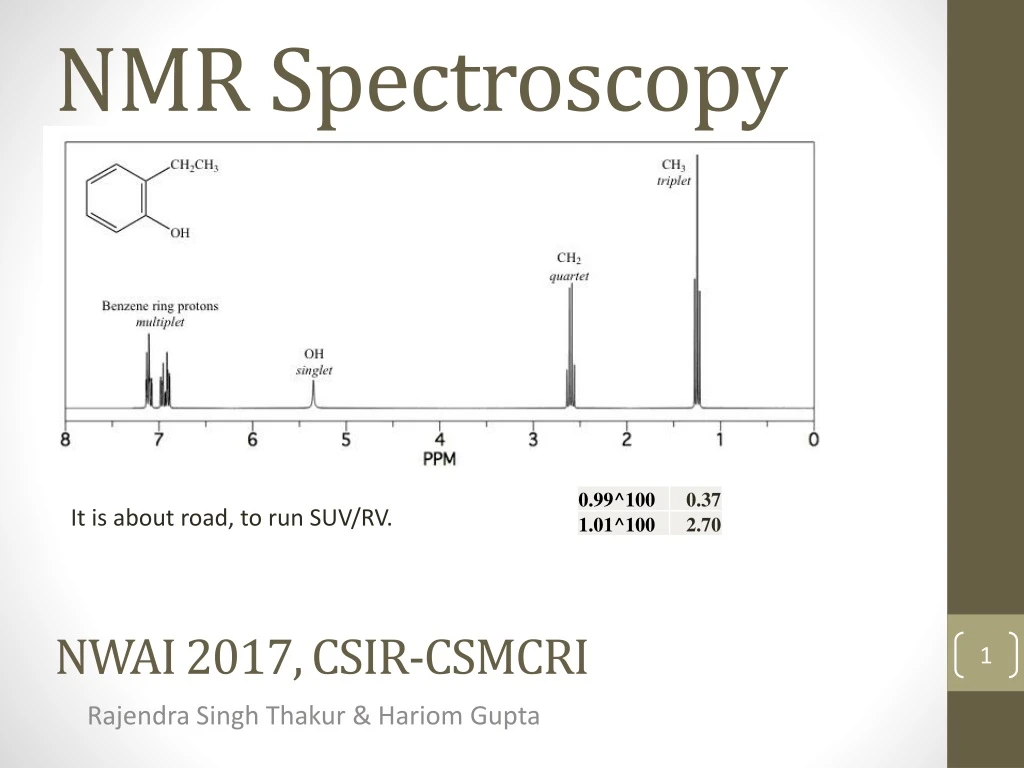
NMR Spectroscopy It is about road, to run SUV/RV. Rajendra Singh Thakur & Hariom Gupta NWAI 2017, CSIR-CSMCRI
Principle and instrumentation North South
NMR active nuclei ? The main important parameter which defines whether a nucleus is NMR active or NMR inactive is the spin quantum no. I. Spin quantum number I is related to the spin of the nuclei. Those nuclei which have even mass number and even atomic number are NMR inactive. Why? Such type of nuclei possess zero spin quantum no. Examples: 1H – Atomic no. 1, Mass no. 1. I = ½. (NMR active) 6C12 – Atomic no. 6, Mass no. 12. I = 0. (NMR inactive) 6C13 – Atomic no. 6, Mass no. 13. I = ½. (NMR active) CHEM-BHAV UNI
Elements in Organic Chemistry There are 4 important elements in Org. Chemistry: (frequency at 2.35T) • H : Best NMR element • 1H , I = ½(sharp lines),a = 99.98% • 2H , I =1 (broad lines), a = 0.02%, Q=0.038 • C : • 12C , I = 0 (no signal in NMR) • 13C ,I = ½(sharp lines),a = 1.1% , • N : • 14N , I =1 (broad lines), a = 99.6%, Q=1.0 • 15N, I = ½(sharp lines),a = 0.4% , • O : • 16O , I = 0 (no signal in NMR) • 17O , I =5/2 (broad lines), a = 0.04%, Q=-0.037 CHEM-BHAV UNI
NMR Periodic Table CHEM-BHAV UNI
How NMR is applied? • NMR spectroscopy involves detection of energy levels of the nucleus created in presence of magnetic field by phenomenon of resonance. • The characteristics of these energy levels are governed by the chemical environment. • Different peaks (& characteristics) for different functional groups, e.g. OH, CHO, COOH, aromatic, amine, steroid, alkaloid.
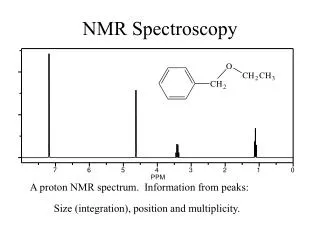
Features of NMR Spectra 10.0 9.0 8.0 7.0 6.0 5.0 4.0 3.0 2.0 1.0 0 BrCH2CH3 Position, multiplicity, intensity ratio 4 lines; quartet 3 lines; triplet CH3 CH2 Chemical shift (, ppm)
NMR Spectra of Ethanol: Signatures (function of environment)
Interpreting NMR Spectra • Counting Hydrogen environments – One molecule can contain many hydrogen environments. Each environment will release a different frequency of energy when it drops down from its excited state to line up with the magnetic field. 2 x H environments so 2 peaks in NMR spectrum. 4 x H environments so 4 peaks in NMR spectrum. 3 x H environments so 3 peaks in NMR spectrum.
Needs high frequency energy to flip here, so high frequency energy released when it flips back. Flips quite easily – needs low frequency energy. 1) The environment of the Hydrogen atom • The frequency of energy needed to flip the magnet (Spin) is different for hydrogen atoms that are in different positions. • So the type of energy given off tells us the position of the hydrogen in the molecule.
2) How many hydrogen atoms are in each position If one hydrogen releases a set amount of energy when it falls back in line (eg 2 units). Then 3 hydrogen atoms will release 3 times that amount when they fall in line (6 units). This affects the size of the peak in the NMR spectrum. The more hydrogen atoms, the bigger the peak!
CH3 OH 200 180 160 140 120 100 80 60 40 20 0 13C spectra: A note for analyst • 7 carbons give 7 signals, but intensities are not equal Chemical shift (, ppm) Unfit for integration: Relaxation and polarisation transfer effects
position of signal - position of TMS peak x 106 d = spectrometer frequency Chemical Shift Chemical shifts (d) are measured relative to the protons in tetramethylsilane (TMS) as a standard. TMS; for organic solvent TMS; for Water etc nPEAK – nREF (Hz) d (ppm) = ------------------------------ = ppm Freq of the nuclei (MHz)
10.0 9.0 8.0 7.0 6.0 5.0 4.0 3.0 2.0 1.0 0 e.g. at 200 MHz: If R-CH(OR)2 appear at 1,000 Hzfrom TMS (0) It’s chemical shift is: d = 1,000 Hz/200 MHz = 5 ppm d is dimensionless(independent from the applied field) n changes with the applied field DownfieldDecreased shielding Up-fieldIncreased shielding (CH3)4Si (TMS) Chemical shift (, ppm); measured relative to TMS
Number of equivalent Appearance Intensities of linesprotons to which H of multiplet in multipletis coupled 1 Doublet 1:1 2 Triplet 1:2:1 3 Quartet 1:3:3:1 4 Pentet 1:4:6:4:1 5 Sextet 1:5:10:10:5:1 6 Septet 1:6:15:20:15:6:1 Splitting Patterns of Common Multiplets
A note for analyst: Coupling with Deuterium (& 13C) Most solvents used in NMR are deuterated (usually to 99%) Therefore, in proton NMR, we observe residual protons with Deuterium coupling (when appropriate). HCD2OD HCD2SOCD3 H D D2 2nI + 1 lines
d 0.9 d 1.3 d 0.9 CH3F CH3OCH3 (CH3)3N CH3CH3 (CH3)4Si d 4.3 d 3.2 d 2.2 d 0.9 d 0.0 least shielded H most shielded H Chemical shift governing factors Electronegative substituents decrease the shielding of methyl groups • CHCl3 7.3 • CH2Cl2 5.3 • CH3Cl 3.1 H3C—CH2—CH3 d 2.0 d 1.0 d 4.3 O2N—CH2—CH2—CH3
d 0.9 d 0.9 CH3 CH3 d 1.6 d 1.2 d 0.8 H3C H C C H3C CH2 CH3 CH3 CH3 Methyl, Methylene, and Methine CH3 more shielded than CH2 ; CH2 more shielded than CH 21
H H H H H C C H H H H H Protons attached to sp2 hybridized carbonareless shielded than those attachedto sp3 hybridized carbon Chemical shift governing factors CH3CH3 7.3 5.3 0.9
d 0.9 d 1.3 d 0.9 5.3 H CH2OCH3 2.4 C C H H H3C CH3 C C 1.5 0.8 H H 1.2 2.6 H3C CH2 Protons attached to sp hybridized carbon are more shielded than those attached to sp2 hybdrized carbon Protons attached to benzylic and allylic carbons are somewhat less shielded than usual H3C—CH2—CH3
O H Cl H H C C d 2.4 H Cl H d 9.7 H3C C C H d 1.1 CH3 Why does the methine proton of 1,1-dichloroethane appear as a quartet? Proton attached to C=O of aldehydeis most deshielded C—H • There are eight combinations of nuclear spins for the three methyl protons. • These 8 combinations split the signal into a 1:3:3:1 quartet.
O 36 114 CH2 CH3 138 36 126-142 C H C CH2 68 84 22 20 13 CH2 CH3 Hybridization effects shielded sp3>sp2 sp3>sp>sp2 Carbonyl carbons are highly deshielded O C CH2 41 171 61 14 127-134
RC CR R2C CR2 Chemical shifts of 13C nuclei Type of carbon Chemical shift (),ppm Type of carbon Chemical shift (),ppm RCH3 0-35 65-90 R2CH2 15-40 100-150 R3CH 25-50 110-175 R4C 30-40
O O RC N Chemical shifts of 13C nuclei Type of carbon Chemical shift (),ppm Type of carbon Chemical shift (),ppm RCH2Br 20-40 110-125 RCH2Cl 25-50 RCOR 160-185 35-50 RCH2NH2 50-65 RCH2OH RCR 190-220 RCH2OR 50-65 27
13C NMR - DEPT(Distortionless Enhancement of Polarization Transfer) In a DEPT135 experiment: -CH3 and CH peaks appear as normal -CH2- peaks appear inverted Quaternary C are not usually seen This way the number of H attached to C can usually be deduced. Standard 13C NMR Spectrum of ethylbenzene
DEPT 135 13C NMR – DEPTSpectra DEPT 90
2D NMR - Spectroscopy 6 7 2 3,4A 4B COSY Correlation Spectroscopy Diagonal peaks represent COSYcorrelation, J-coupling partners i.e. bonding. 2D NMR experiment names “C” at the end often stands for Correlation
Why 2D? COSY Application 1 D spectra of a mixture: 2 J-coupled pairs of similar coupling constant. 3 possibilities will lead to 3 different COSY spectrum. Useful for resolving assignment ambiguity and mixture analysis.