Download
1 / 17
200 likes | 632 Vues
Exsolution and Phase Diagrams. Lecture 11. Alkali Feldspar Exsolution. ‘Microcline’ - an alkali feldspar in which Na- and K-rich bands have formed perpendicular to the twinning direction. This leads to this cross-hatched or fabric-like texture under crossed polarizers. G-bar–X and Exsolution.

E N D
Exsolutionand Phase Diagrams Lecture 11
Alkali Feldspar Exsolution ‘Microcline’ - an alkali feldspar in which Na- and K-rich bands have formed perpendicular to the twinning direction. This leads to this cross-hatched or fabric-like texture under crossed polarizers.
G-bar–X and Exsolution • We can use G-bar–X diagrams to predict when exsolution will occur. • Our rule is that the stable configuration is the one with the lowest free energy. • A solution is stable so long as its free energy is lower than that of a physical mixture. • Gets tricky because the phases in the mixture can be solutions themselves.
Inflection Points • At 800˚C, ∆Greal defines a continuously concave upward path, while at lower temperatures, such as 600˚C (Figure 4.1), inflections occur and there is a region where ∆Greal is concave downward. All this suggests we can use calculus to predict exsolution. • Inflection points occur when curves go from convex to concave (and visa versa). • What property does a function have at these points? • Second derivative is 0. Albite-Orthoclase
Inflection Points • Second derivative is: • First term on r.h.s. is always positive (concave up). • Inflection will occur when
Spinodal Actual solubility gap can be less than predicted because an increase is free energy is required to begin the exsolution process.
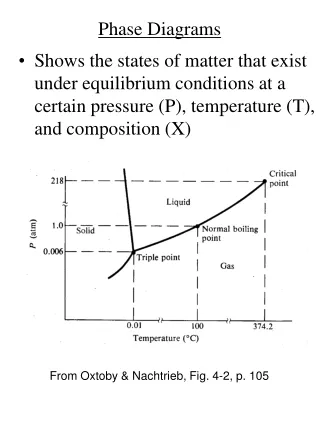
Phase Diagrams • Phase diagrams illustrate stability of phases or assemblages of phases as a function of two or more thermodynamic variables (such as P, T, X, V). • Lines mark boundaries where one assemblage reacts to form the other (∆Gr=0).
Thermodynamics of Melting • Melting occurs when free energy of melting, ∆Gm, is 0 (and only when it is 0). • This occurs when: ∆Gm = ∆Hm –T∆Sm • Hence: • Assuming ∆S and ∆H are independent of T: • where Ti,m is the freezing point of pure i, Tis the freezing point of the solution, and the activity is the activity of i in the liquid phase. T-X phase diagram for the system anorthite-diopside.
Computing an Approximate Phase Diagram We assume the liquid is an ideal solution (ai = Xi) and compute over the range of Xi
Constructing T-X phase diagrams from G-bar–X diagrams We can use thermodynamic data to predict phase stability, in this case as a function of temperature and composition
Phase Rule and Phase Diagrams • Phase rule: ƒ = c – ϕ + 2; c = 2 for a binary system. • Accordingly, we have ƒ = 4 – ϕ and: PhasesFree compositional variables • Univariant ϕ = 3; 2 solids + liquid, 2 liquids + solid 3 solids or liquids 0 • Divariantϕ = 2; 1 solid + 1 liquid, 2 solids, 2 liquids 0 • Trivariantϕ = 1; 1 solid or 1 liquid 1 Trivariant System G-bar-X diagram for a trivariant, one-phase system exhibiting complete solid solution. Need to specify P, T, and X to completely describe the system.
Divariant Systems • We need to specify both T and P (G-bar–X relevant only to that T and P). Two phases coexist on a plane in T–P–X space. • G-bar-X diagrams for different divariant systems • (a) Liquid solution plus pure solid • (b) Liquid solution plus solid solution • (c) Two pure solids • (d) Limited solid solution (limited liquid solution would be the same) • The free energy of the system as a whole is that of a mechanical mixture of phases – described by straight line through or tangent to free energies of individual phases. • We deduce compositions of solutions by drawing tangents between curves (or points) for phases.
Univariant Systems • One degree of freedom. • We specify only P or T. • Three phases in binary system can coexist along a line (not a plane) in P-T-X space. • only at one T, once we specify P (and visa versa). • Compositions of solutions are determined by drawing tangents.
Plagioclase Solution • Unlike alkali feldspar, Na-Ca feldspar (plagioclase) forms a complete solid (and liquid) solution. • Let’s construct the melting phase diagram from thermodynamics. • For simplicity, we assume both liquid and solid solutions are ideal.
Plagioclase Solution • Condition for equilibrium: • e.g. • Chemical potential is • Combining these: • standard states are the pure end member solids and liquids.
Plagioclase Solution • The l.h.s. is simply ∆Gm for the pure component: • rearranging • Since XAn = 1 - XAb error in book: Ab on lhs should be An
Plagioclase Solution • From: • Solving for mole fraction of Ab in the liquid: • The mole fraction of any component of any phase in this system can be predicted from the thermodynamic properties of the end-members. • In the ideal case, as here, it simply depends on ∆Gmand T. • In a non-ideal case, it would depend on Gexcessas well. • Computing the equation above (and a similar one for the solid), we can compute the phase diagram.