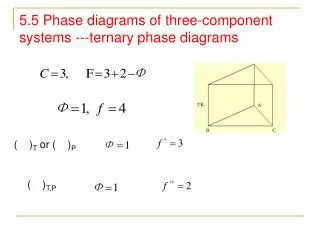
Download
1 / 7
70 likes | 245 Vues
critical point (647 K, 218 atm). P. solid. liquid. vapor. 1 atm. triple point (273.16 K, 0.0059 atm). T (K). 700 K. 273.15 K. 273.16 K. 373.15 K. T (K). vapor cools. vapor condenses to liquid. vapor consumed. liquid cools. liquid freezes to solid.

E N D
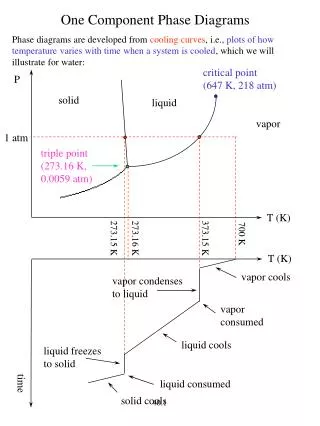
critical point (647 K, 218 atm) P solid liquid vapor 1 atm triple point (273.16 K, 0.0059 atm) T (K) 700 K 273.15 K 273.16 K 373.15 K T (K) vapor cools vapor condenses to liquid vapor consumed liquid cools liquid freezes to solid liquid consumed time solid cools One Component Phase Diagrams Phase diagrams are developed from cooling curves, i.e., plots of how temperature varies with time when a system is cooled, which we will illustrate for water: 40.1
Suppose we cool some water vapor at a constant pressure of 1 atm that is initially at 700 K. How many degrees of freedom are available to the vapor whose pressure is fixed at 1 atm? As heat is removed from the vapor during cooling, the temperature of the vapor falls until it reaches a temperature where the liquid phase begins to condense. At what temperature does water vapor begin to condense to a liquid when the pressure is 1 atm? How many degrees of freedom are present once the liquid water begins to form? As we continue to cool the system the temperature remains constant, during what is referred to as a halt in the cooling curve, while water vapor condenses to liquid water. Why does the temperature remain constant during the condensation of the vapor to the liquid? When the vapor has been consumed the temperature falls once again (why?) until a temperature is reached where the liquid begins to freeze to the solid (what temperature is this?). As we continue to cool the system the temperature remains constant (why?) while liquid water freezes to ice. Finally, once the water has all frozen the temperature once again begins to fall (why?). 40.2
The breaks in the cooling curve at a given pressure identify the temperatures at which the phases are in equilibrium at this pressure and allow points on the phase boundaries to be plotted. If the experiment is repeated at other pressures, other points on the phase boundaries can be established. In this way the curves that define the equilibrium P & T boundaries separating the phases can be established. Points where lines of equilibria cross are known as triple points, where three phases are in equilibrium. Note that the triple point of water occurs at 0.0059 atm and 273.16 K or 0.01 oC above the normal freezing point of water. What geometrical object (point, line, surface, or volume) would describe where three phases are in equilibrium in a 3-dimensional binary phase diagram? At the critical point the physical differences between the vapor and liquid phases disappear and the boundary separating these phases terminates. For water this occurs at 647 K and 218 atm. Ar is used in some chromatographic and spectroscopic techniques as a medium in which to carry the sample. The Ar is usually delivered in large unrefrigerated tanks that are at room temperature and under high pressure. The critical temperature for Ar is 150.8 K. Is liquid Ar present in these tanks? 40.3
Ice VII 100 Vapor 80 60 Liquid Temperature ( oC) 40 20 Ice VI 0 Ice III - 20 Ice V Ice I Ice II - 40 30 0 2.5 7.5 20 10 5 Pressure (kBar) Many, if not most, substances exhibit multiple solid phases. The 1-component phase diagram for water, now extended to considerably higher pressures, is shown below: Data supporting this diagram can be found in J. Chem. Phys., 5:965 (1937) 40.4
What do you think happened to ice IV? Liquid water boils at 1 atm and 100 oC. At 25,000 bar and ~ 100 oC what does ice VII do? How many triple points are there in the preceding high pressure phase diagram for water? The fictional ice IX only exists in Kurt Vonnegut’s book Cat’s Cradle (a good read, if you haven’t read it). In this fictional tale, liquid water is supersaturated with respect to ice IX and so a single crystal of ice IX dropped into the world’s oceans would cause them to crystallize to a solid. Kurt Vonnegut got this idea from his brother Bernard Vonnegut, who worked on seeding clouds at General Electric and who had speculated about the existence of forms of crystalline water stable above 0.0 oC (see the Letters section of the November, 1986 issue of Physics Today). 40.5
(304 K, 71.8 atm) P (217 K, 5.04 atm) 1 atm T (K) - 78 oC The phase diagram for carbon dioxide is shown below: At what point can the liquid and vapor phases of carbon dioxide no longer be distinguished? At what point are the solid, liquid, and vapor phases of carbon dioxide in equilibrium? What is the normal sublimation temperature of carbon dioxide? Does carbon dioxide have a normal melting and boiling point? Why is carbon dioxide referred to as dry ice? 40.6
1000 diamond 100 liquid Pressure (kbar) 10.0 graphite region of synthetic diamond formation 1.00 0.10 vapor 3000 K 4000 K Temperature An approximately correct phase diagram for carbon is shown below (see J. Chem. Phys., 46:3427 (1967) for more details): What is the stable form of carbon at 25.0 oC and 1 atm? Can diamond sublime? Graphite can be converted into diamond at 3000 K and 50 kbar, but the rate of conversion is slow. The rate is reasonable at 4000 K and 100 kbar, but no apparatus can be constructed which can withstand these conditions. To increase the rate of conversion at lower temperatures and pressures Cr, Fe, or Pt catalysts are employed. Synthetic diamonds can be identified by the presence of traces of these catalysts. 40.7