Download
1 / 12
120 likes | 233 Vues
Inter-comparison of Lightning Trends from Ground-based Networks during Severe Weather: Applications toward GLM. Lawrence D. Carey 1* , Chris J. Schultz 1 , Walter A. Petersen 2 , Scott D. Rudlosky 3 , Monte Bateman 4 , Daniel J. Cecil 1 , Richard J. Blakeslee 2 , Steven J. Goodman 5

E N D
Inter-comparison of Lightning Trends from Ground-based Networks during Severe Weather: Applications toward GLM Lawrence D. Carey1*, Chris J. Schultz1, Walter A. Petersen2, Scott D. Rudlosky3, Monte Bateman4, Daniel J. Cecil1, Richard J. Blakeslee2, Steven J. Goodman5 1 University of Alabama in Huntsville, Huntsville, Alabama 2 Earth Sciences Office, NASA Marshall Space Flight Center, Huntsville, Alabama 3 University of Maryland, College Park, Maryland 4 USRA (NASA MSFC), Huntsville, Alabama 5 NOAA NESDIS, Silver Springs, Maryland
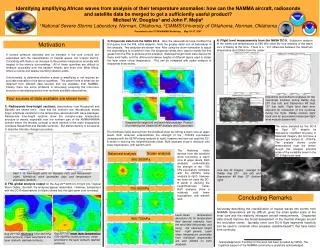
Total lightning flash rate trends have demonstrated value for forecasting high impact weather. • Total lightning trends are well observed by VHF systems like the Northern Alabama Lightning Mapping Array (NALMA) • > 90% flash detection efficiency within about 100-150 km • Fine spatial resolution (< 1 km) at those ranges. • To expand GOES-R GLM (Geostationary Lightning Mapper) proxy applications for high impact convective weather (e.g., severe, aviation hazards) research, it is desirable to investigate utility of additional sources of continuous (total) lightning • that can serve as suitable GLM proxy over large spatial scales (order 100’s to 1000 km or more) • including typically data denied regions such as the oceans. Motivation
Potential sources of GLM proxy include ground-based long-range regional VLF/LF lightning networks such as Weatherbug Total Lightning Network (WTLN) • For comparison, consider Vaisala National Lightning Detection Network (NLDN) all flash data (CG+IC) • Use NALMA as a reference source of total lightning • Consider effect of range on NALMA flash detection efficiency (0-50, 50-100, 100-150, 150-200 km range bins) • Approach: Convective-cell based total lightning flash rates and trends • Tailored to test directly the efficacy of total lightning data sources in potential weather applications and algorithms like lightning jump (LJ) • Integrates both detection efficiency and location accuracy effects Data and Methodology
Cell identification and tracking using NCAR’s Thunderstorm Identification, Tracking and Nowcasting (TITAN) algorithm (Dixon and Weiner 1993) • WSR-88D data (e.g., KHTX Hytop radar in N. Alabama) • Tracking > 35 dBZ features at -13 C (5-7 km) following LJ algorithm by Schultz et al. (2009, 2011) • Locations and major axes of tracked radar echo ellipsoids used to bin NALMA, WTLN and NLDN total lightning flashes every 1-minute into “cells”. • Compare cell-based total flash rates and trends from each lightning network for sample of severe and non-severe cells. • 70 tracked cells for 6188 minutes on 8 days in N. Alabama • 3/12/2010, 4/25/2010, 7/26/2010, 8/5/2010, 9/11/2010*, 10/26/2010, 3/30/2011, 4/27/2011 (*non-severe) Data and Methodology
Severe supercell storm: large hail (some over 2”), winds Results – Cell A1H, 3/12/2010
Ratio of mean cell flash rates by range (km) of cell from NALMA center Mean temporal correlation of cell flash rate (2 minute average)by range (km) of cell from NALMA center Results – Cell A1H, 3/12/2010
Ratio of mean (median) cell flash rates* by range (km) of cell from NALMA center Mean temporal correlation of cell flash rate* (2 minute average)by range (km) of cell from NALMA center Results – All 70 cells * Conditional – eliminated consensus non-lightning periods
Ratio of mean (median) cell flash rates* by range (km) of cell from NALMA center Mean temporal correlation of cell flash rate* (2 minute average) by range (km) of cell from NALMA center Results – All cells except 8/5/2010 * Conditional – eliminated consensus non-lightning periods
Comparison between NALMA and WTLN total lightning flash rates are reasonable • WTLN cell flash rates are 45% to 60% (60% to 90%) of NALMA cell flash rates at 0–50 km (50–100 km) range, in the mean/median • By 100-150 km range, mean WTLN and NALMA cell flash rates are comparable • Importantly for Lightning Jump, the temporal trend of the WTLN cell flash rate is reasonably correlated to NALMA cell flash rate ( 0.8 at 0-150 km range, in the mean) • Evaluation of proxy data is ongoing and being accomplished in a holistic fashion, focusing on both the lightning measurement and the meteorological application • Stroke/flash matching, gridded products, cell-based • Evaluating a variety of VLF/LF lightning network data sources by inter-comparison with NALMA and TRMM LIS • GLD-360, NLDN, WTLN, WWLLN Summary