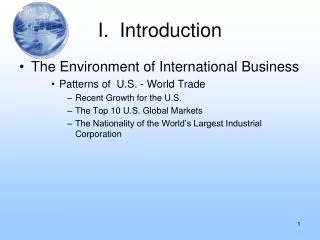
I. Introduction
I. Introduction The Environment of International Business Patterns of U.S. - World Trade Recent Growth for the U.S. The Top 10 U.S. Global Markets The Nationality of the World’s Largest Industrial Corporation Introduction Major Participants in Global Trade: The Triangle

I. Introduction
E N D
Presentation Transcript
I. Introduction • The Environment of International Business • Patterns of U.S. - World Trade • Recent Growth for the U.S. • The Top 10 U.S. Global Markets • The Nationality of the World’s Largest Industrial Corporation
Introduction • Major Participants in Global Trade: The Triangle • The European Community • North America (NAFTA) • Asia Pacific
Introduction “By 2015, we will live in an intensely customer-centric market dominated by global mega banks and densely populated by specialist financial services providers. Fierce competition, global regulation and technology will reshape bank and non-bank structures” • Mark Greene, Banking 2015, IBM Study Nov 2005
The Nationality of the World’s Largest Corporations • Country Number of Firms • United States 32 • Japan 23 • Germany 14 • France 6 • Britain 4 • Italy 4
Top 10 Countries for U.S. Exports (2005) Canada ... US$211.9 billion (up 31.7% from 2002) Mexico ... $120.4 billion (up 23.5%) Japan ... $55.5 billion (up 7.8%) China ... $41.9 billion (up 89.6%) United Kingdom ...$38.6 billion (up 16.3%) Germany ... $34.2 billion (up 28.6%) South Korea ... $27.8 billion (up 23%) Netherlands ... $26.5 billion (up 44.8%) France ... $22.4 billion (up 17.9%) Taiwan ... $22.1 billion (up 20.1%)
Top 10 Countries U.S. Imports (2005) Canada ... US$290.4 billion (up 38.9% from 2002) China ... $243.5 billion (up 94.5%) Mexico ... $170.1 billion (up 26.4%) Japan ... $138 billion (up 13.7%) Germany ...$84.8 billion (up 35.7%) United Kingdom ... $51 billion (up 25.3%) South Korea ... $43.8 billion (up 23%) Taiwan ... $34.8 billion (up 8.4%) Venezuela ... $34 billion (up 125.2%) France ... $33.8 billion (up 19.9%)
TOP TEN U.S. MARKETS • Canada, China, Japan and Mexico supplied more than half of U.S. imports in 2005. • Oil-producer Venezuela showed the highest percentage gain in its exports to the U.S. • However, China's exports to the U.S. almost doubled since 2002, and account for a much higher share of world exports to the U.S. when compared to the smaller number for Venezuelan exports
US Trade Trends The top 4 nations in the following list were responsible for 54% of America's total trade deficit in 2005. Trade deficit = Exports - Imports
Top 10 Countries Contributing to U.S. Trade Deficit (2005) China ... -$201.5 billion (up 95.4% from 2002) Japan ... -$82.5 billion (up 17.9%) Canada ... -$78.5 billion (up 62.9%) Germany ... -$50.6 billion (up 40.9%) Mexico ... -$49.7 billion (up 33.6%) Venezuela ... -$27.6 billion (up 157.9%) Malaysia ... -$23.2 billion (up 69.3%) Nigeria ... -$22.6 billion (up 361.2%) Saudi Arabia ... -$20.4 billion (up 142.9%) Italy ... -$19.5 billion (up 37.3%)
US Trade Trends 2007 The total value of U.S. exported goods to the rest of the world: • US$1.16 trillion • A 12.2% gain since 2006 • rate that exceeds the 5.4% gain in overall American imports for the same period
Fastest-Growing U.S. Exports American exports that experienced the highest percentage gains in 2007: • Business machines excluding computers ... US$5.4 billion (up 99.6% from 2006, up 179.8% from 2003) • Wheat: $8.5 billion (up 99%, up 111.6%) • Sorghum, barley and oats: $1.2 billion (up 74.7%, up 82.4%) • Dairy products and eggs: 2.5 billion (up 64.2%, up 229.1%) • Oilseeds and food oils: $2 billion (up 53.1%, up 43.4%) • Nonmonetary gold: $13.3 billion (up 51.7%, up 178.2%)
US Trade Trends The list for the fastest-growing exports from the United States 2007 • Business machines • wheat • barley • oats
US Trade Trends Fastest-declining exports from the U.S. • blank audio and video media • metalworking machine tools • computer accessories • manufactured tobacco
America’s leading Exports in 2007. Top 6 U.S. Exports Semiconductors: US$50.2 billion (4.3% of US total Exports, down 4.3% from 2006) Complete civilian aircraft: $48.8 billion (4.2%, up 19.6%) Automotive parts/accessories: $44.2 billion (3.8%, up 2%) New/used passenger cars: $43.7 billion (3.8%, up 28.6%) Other industrial machines: $38.3 billion (3.3%, up 17.1%) Pharmaceutical preparations: $35 billion (3%, up 13.2%)
Fastest-Declining U.S. Exports American product categories for exports with the greatest percentage declines last year. • Audio and video media ... US$584.3 million (down 67.5% from 2006, down 56.6% from 2003) • Metalworking machine tools ... $6.7 billion (down 29.3%, down 27.8%) • Computer accessories ... $29.4 billion (down 18.7%, down 6.1%) • Manufactured tobacco ... $1.2 billion (down 15.1%, down 38.5%) • Complete military aircraft ... $4 billion (down 10.5%, up 85%) • Textile apparel and household goods ... $4.7 billion (down 9.3%, down 20.5%)
“Waiting in the Wings” • Big Emerging Markets • Brazil - China • Mexico - Indonesia • Poland - South Africa • Argentina - India
TRADE WEBSITES http://www.tradeport.org/ http://www.buyusainfo.net/
By Next Class Your Group Knows: • Who the members are (emails, cell, etc) • Country to export or import from • Three potential products the group will trade • Group contribution to relevant websites