Utilizing Short-Time Speech Transmission Index to Predict Speech Reception Thresholds
This study explores the effectiveness of the Short-Time Speech Transmission Index (ST-STI) in predicting Speech Reception Thresholds (SRTs) in fluctuating noise environments. By analyzing short analysis windows (80 ms), we observe that the extended ST-STI can accurately differentiate between intelligibility in stationary and fluctuating maskers. The influence of lowpass filter cutoff frequencies is examined, with a focus on the 50 Hz cutoff for optimal results. Our findings indicate that both the extended ST-STI and the Extended Speech Intelligibility Index (ESII) provide robust predictions of SRTs across various noise types.

Utilizing Short-Time Speech Transmission Index to Predict Speech Reception Thresholds
E N D
Presentation Transcript
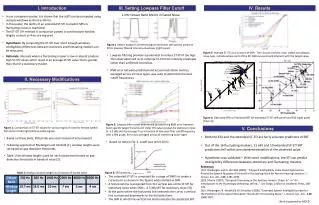
I.Introduction III. Setting Lowpass Filter Cutoff IV.Results 1 kHz Octave Band Metric in Gated Noise • In our companion poster, it is shown that the ssSTI can be computed using analysis windows as short as 80 ms. • In this poster, the ability of an extended ST-STI to predict SRTs in fluctuating noises is examined. • The ST-STI (TH method in companion poster) is used because window lengths as short as 4 ms are required. • Hypothesis: By computing the ST-STI over short enough windows, intelligibility differences between stationary and fluctuating maskers can be measured. • Rationale: Intervals where a fluctuating masker is low or absent produce high ST-STI values which result in an average ST-STI value that is greater than that of a stationary masker. • Figure 2. Metric based on unfiltered signal intensities (left panel); based on 50 Hz lowpass filtered intensity envelopes (right panel). • Lowpass filtering provides a parameter to reduce ST-STI if too high. This observation led us to compute ST-STI from intensity envelopes rather than unfiltered intensities. • RMS error between predicted and actual modulation metrics, averaged across all noise types, was used to determine the best cutoff frequencies. Figure 5: Average ST-STI as a function of SNR. The circular markers, color coded according to noise type, indicate where each of the STI-SNR curves should intersect with the target value. II. Necessary Modifications Target ST-STI Modified ST-STI Figure 6: Observed SRTs vs Predicted SRT for extended ST-STI (left panel) and ESII (right panel [from 3]). • Figure 3: Lowpass filter cutoff determined by examining RMS error between band-specific target Transmission Index (TI) values (values for stationary noise at -5.5 dB) and the average TI as a function of low-pass filter cutoff frequency with a SSN probe. Error was averaged across all interfering noise types • Based on data in Fig. 3, cutoff was set at 50 Hz. V.Conclusions • Figure 1. Comparison of ST-STI values for various types of noise for female speech (left plot) vs SSN (right plot) as probe signals. • Based on these plots, SSN probe was used instead of actual speech • Following approach of Rhebergen and Versfeld[1], window lengths were set based on gap detection thresholds. • Table 1 lists window lengths used for each octave band based on gap detection thresholds in bands of noise [2]. • Both the ESII and the extended ST-STI are fairly accurate predictors of SRT. • Out of the 16 fluctuating maskers, 11 eSII and 10 extended ST-STI SRT predictions fell within one standard deviation of the observed value. • Hypothesis was validated – With some modifications, the STI can predict intelligibility differences between stationary and fluctuating maskers. References [1] K. Rhebergenand N. Versfeld(2005), "A Speech Intelligibility Index-based Approach to Predict the Speech Reception Threshold in Fluctuating Noise for Normal-hearing Listeners," J. Acoust. Soc. Am., 117,2181-2192. [2] B. Moore (1997), "Temporal Processing in the Auditory System, Chapt. 4," in "An Introduction to the Psychology of Hearing, 4th ed.," San Diego, California: Academic Press, 148-176. [3] K. Rhebergen, N. Versfeld & W. Dreschler(2006), "Extended Speech Intelligibility Index for the Prediction of the Speech Reception Threshold in Fluctuating Noise," J. Acoust. Soc. Am., 1 20 3988-3997. Table 1: Analysis window length as a function of octave band • Figure 4: SRT prediction algorithm • The extended ST-STI is computed for a range of SNR's to create a curve (such as shown in the figure) when plotted vs SNR. • A horizontal line is projected from the vertical axis at the ST-STI for stationary noise when SNR = -5.5 dB (SRT for stationary noise [3]) • At the point where the horizontal line intersects the curve, a vertical line is projected downwards to the horizontal axis. • The SNR at which the vertical line lands indicates the predicted SRT. Work supported by NIDCD
2aSC8: Using the Short-Time Speech Transmission Index to Predict Speech Reception Thresholds in Fluctuating Noise Matthew J. Ferreira and Karen L. Payton; Electrical & Computer Engineering Department University of Massachusetts Dartmouth, N. Dartmouth, MA