Download
1 / 1
10 likes | 459 Vues
Application of Satellite Altimetry to Tropical Climate Modeling and Prediction Dake Chen, Alexey Kaplan and Mark Cane Lamont-Doherty Earth Observatory of Columbia University

E N D
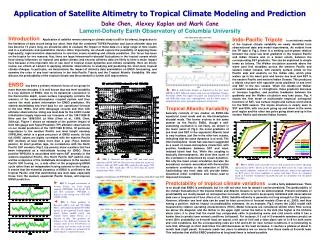
Application of Satellite Altimetry to Tropical Climate Modeling and Prediction Dake Chen, Alexey Kaplan and Mark Cane Lamont-Doherty Earth Observatory of Columbia University IntroductionApplication of satellite remote sensing to climate study is still in its infancy, largely due to the limitation of data record being too short. Now that the combined TOPEX/Poseidon and Jason altimeter data set has become 15 years long, we should be able to evaluate the impact of these data on a large range of time scales and in a systematic and quantitative manner. More importantly, we should explore the possibility of applying these high-quality, high-resolution observations to real-time ocean modeling and climate prediction. Our focus has been on the tropics for two reasons: first, there are large interannual-to-decadal fluctuations in the tropical oceans which have strong influences on regional and global climate; and second, altimetry data are likely to have a major impact here because of the important role of sea level in tropical ocean dynamics and climate variability. Here we briefly review our efforts at Lamont in applying altimeter observations to studying and predicting the short-term tropical climate changes. In particular, we demonstrate the impact of altimetry data assimilation on ENSO forecasting, and examine the roles of sea level variations in the Indo-Pacific Tripole and the Tropical Atlantic Variability. We also discuss the predictability of the tropical climate and the potential for further skill improvement. Indo-Pacific Tripole is an intrinsic mode of the tropical climate variability we newly identified from observational data and model experiments. As evident from the TP data in Fig.3, there is a striking out-of-phase relation between the zonal sea level gradients in the tropical Pacific and Indian Oceans and, to a lesser extent, between the corresponding SST gradients. This can be explained in simple terms as follows. The Walker circulation ascends above the warm pool that straddles across the western Pacific and eastern Indian Oceans, with easterly surface winds on the Pacific side and westerly on the Indian side, which piles waters up in the warm pool and lowers sea level and SST in the eastern Pacific and western Indian Oceans. This produces a tripole structure with opposite zonal gradients of sea level and SST in the two oceans. When the double-cell Walker circulation weakens or strengthens, these gradients decrease or increase together, and positive feedbacks between the gradients and the Walker circulation may take place. Fig. 4 shows the first mode of multivariate empirical orthogonal functions of SST, sea surface height and surface wind stress for the SON season. The tripole structure is clearly seen in SST and SSH, with one pole going up and down in the warm pool region and the other two poles going down and up in the eastern Pacific and western Indian Oceans. ENSO has been a primary research focus of our group for more than two decades. It is well known that sea level variability is a key element of ENSO. Due to its dynamical connection to the thermocline depth, ocean surface topography contains the memory of the ocean-atmosphere coupled system and thus carries the most potent information for ENSO prediction. We started assimilating sea level data for our operational forecast in the late 1990s, first with tide-gauge records and then with altimeter observations. Using sea level data for the LDEO model initialization largely improved our forecasts of the 1997/1998 El Niño and the 1999/2000 La Niña (Chen et al., 1998; Chen, 2001a,b). Figure 1 shows an example of the positive impact of both tide gauge and Topex/Poseidon (TP) altimeter observations on our model prediction of the 1997/1998 El Niño. Of particular importance is the western Pacific sea level height anomaly (WPSLHA), which is a good precursor of ENSO events. its late fall (OND) values are highly correlated with the eastern Pacific SST anomaly at lead times more than a year (Fig.2, bottom panels). At short positive lags, its correlations with the North Pacific SLP anomaly (Fig.2, top panels) show a pattern that has been interpreted as a mid-latitude forcing for ENSO. Since positive WPSLHA is associated with warm SST anomaly in the western equatorial Pacific, this North Pacific SLP pattern may well be a response of the midlatitude atmosphere to the western Pacific SST forcing, i.e., a side effect of the progressing ENSO cycle rather than an independent forcing external to the tropics. It seems that the essential dynamics of ENSO is confined to the tropical Pacific, and that assimilating sea level data, especially those from the western equatorial Pacific Ocean, will improve ENSO prediction. ▲FIG 4.Indo-Pacific Tripole as depicted by the first mode MEOFs of SST, SSH and surface wind stress for September-October-November (SON). The upper two panels are spatial patterns of SST and SSH with wind stress superimposed, and the lower panel is normalized time series (principal component) of the mode. Tropical Atlantic Variability basically consists of two modes: an ENSO-like equatorial zonal mode and an inter-hemisphere decadal mode. The former evolves in the same manner as the Pacific ENSO, though a self-sustaining oscillation is not likely. As shown in the lower panel of Fig.3, the zonal gradients of sea level and SST in the equatorial Atlantic tend to vary in phase, just like in the other two oceans, indicating that the same dynamics is at work. The inter-hemisphere mode has also been suggested as a result of ocean-atmosphere interaction, with positive feedbacks between SST and wind-induced latent heat flux. While this coupling is basically thermodynamic, the slow time scale of the oscillation is determined by ocean dynamics. Not only the mean ocean circulation, but also the anomalous currents associated with thermocline variations contribute to the advection of SSTA. Assimilating sea level data will provide better dynamical initial conditions and hence lead to improved forecasts. ▲FIG 1.Observed and forecast SST and wind stress anomalies in DJF 1997-98. Forecasts were made two seasons in advance, with only FSU winds, FSU winds plus tide gauge (TG) sea level, or FSU winds plus TP sea level data for model initialization (Chen , 2001a). ▲FIG 5.LDEO model ensemble forecast skill measured by relative operating characteristics (ROC). Shown in the left panel are ROC curves for warm, cold and near normal conditions, respectively, at 6-month lead time, while in the right panel are ROC curves for warm conditions at various lead times. These are calculated based on 5-member retrospective ensemble forecasts for all months over the period 1856-2003. ►FIG 2.Lagged correlations of western Pacific sea level height anomaly (WPSLHA) with Pacific SLP and SST anomalies. WPSLHA is defined as the average over 150S-50N, 1200W-1500E. Predictability of tropical climate variations is still a hotly debated issue. There is no doubt that ENSO is predictable, but it is still not clear how far ahead it can be predicted. The predictability of the climate fluctuations in the tropical Indian and Atlantic Oceans is yet to be demonstrated. Present estimates of predictability are mostly based on retrospective forecasts, which need to be properly initialized with observational data over a long-period of time (Chen et al., 2004). Satellite altimetry is generally not long enough for this purpose. However, altimeter sea level data can be used for bias correction of forecast models (Chen et al., 2000), and thus having a positive, indirect impact on predictability estimates. As an example, Fig.5 shows the LDEO model skill measured by relative operating characteristics (ROC). Model forecasts are considered skillful when ROC curves are above the diagonal, and the farther to the upper right corner the better is the skill (the higher is the hit/false alarm ratio). It is clear that the model has comparable skills in predicting warm and cold events while it has a harder time to predict near normal conditions (left panel). For instance, if 3 out of 5 ensemble members predict an event (60% probability) at 6-month lead, we expect a hit rate of 0.64 and a false alarm rate of 0.18 for both warm and cold conditions, but the corresponding rates are 0.52 and 0.25 for near normal conditions. It is interesting to note that, although at short lead times the skill decreases as the lead increases, it reaches a plateau at about 9-month lead (right panel). Forecasts made two years in advance are no worse than those made at 9-month lead. This indicates that skillful ENSO prediction at long lead times is indeed possible. ◄FIG 3. Zonal gradients of Reynolds SSTA (red) and TP SSHA (blue), and zonally integrated TP SSHA (green) in the equatorial Pacific (upper panel), Indian (middle panel), and Atlantic (lower panel) Oceans, as a function of time. The gradients are defined as the difference between the average values in two 100x100 boxes at the eastern and western ends of each ocean. All variables are normalized by their respective standard deviation.