Thomas Weisel Partners
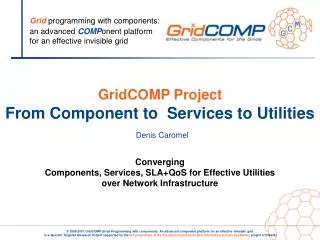
Thomas Weisel Partners. Alternative Energy. Sector Weighting: Market Weight. Jeff Osborne 212 271-3577 josborne@tweisel.com. No Silver Bullet Solution to World’s Energy Crisis. Source: Greentech Media. Alternative Energy “Investability” Matrix. Solar

Thomas Weisel Partners
E N D
Presentation Transcript
Thomas Weisel Partners Alternative Energy Sector Weighting: Market Weight Jeff Osborne 212 271-3577 josborne@tweisel.com
No Silver Bullet Solution to World’s Energy Crisis Source: Greentech Media
Alternative Energy “Investability” Matrix • Solar • Profitability along entire supply chain, though rapid commoditization driving margin contraction. • Global market cap > $200bn, though several emerging privately held players. • Cumulative installed capacity ~9GW as of 2007 • Addressable market for solar PV could be $100-$200bn between 2008-10, based on $5-10/watt installed cost while addressable market for equipment manufacturers could be $15-20bn based on capacity projections. • Several technologies exist, no silver bullet solution. Cost per watt is key. Solar generated power currently costs $0.15-$0.45/kWh. • Of late, competition heating up in thin film solar, while solar thermal and concentrated PV gaining momentum, though few if any public participants. • Traditional PV cells/modules: • -Sharp • -Q-Cells • -Suntech • Traditional PV vertically integrated: • -REC • -SunPower • Thin Film PV: • -Energy Conversion Devices • -First Solar • Polysilicon: • -MEMC • -Wacker-Chemie • -DC Chemical • -Timminco • -Globe Specialty Metals • Equipment and Component Manufacturers: • -Applied Materials • -BTU International • -Oerlikon • -GT Solar • -Centrotherm • -Meyer Burger • -Toyo Tanso • Wind • Highly profitable. • Global market cap > $500bn, driven by large diversified industrials like GE, Siemens, etc. • Lack of domestically traded pure-plays lowers investability. • Largest pure play producers not traded in US. • Cumulative installed capacity ~90GW as of 2007 • Addressable market for wind could be $175-$250bn between 2008-2010 based on $2.00-2.50/watt installed cost. • Key variable in cost is raw materials such as steel for turbines and towers. • Wind-generated power costs as little as $0.05/kWh but distribution and transmission becoming more important. • Pure play wind energy players: • Gamesa • Vestas • Enercon • Suzlon • Clipper • Diversified industrials: • GE Wind • Mitsubishi Heavy • Siemens • Bioproducts • Biofuels and bio-products linked to volatile input and output prices currently with minimal IP; lowering investability. • Large potential market for products; substitute for petrol in many applications such as plastics, motor fuel, cleaners, solvents, etc. • Market cap ~$100bn domestically and much larger internationally; extremely diverse encompassing technology, agri business, fuels, etc. • Highly dependent on government subsidies and support; public support is beginning to wane as corn agricultural prices climb. • Promise of cellulosic ethanol: Improvements in enzyme tech are required to meet long term ethanol production targets. Developers of these enzymes should have strong intellectual property position and therefore minimal commodity risk but are a long way from viable commercial production (Most are private companies) • Ethanol producers: • -Archer Daniels Midland • -Aventine • -Pacific Ethanol • -Panda • -Verasun/US BioEnergy • -Cosan • Other bioproducts • -Metabolix • -Nova Biosource • -Verenium • -Xethanol • Smart Grid/ Energy Efficiency • Attractive opportunity for investors over next 3-5 years. Grid upgrade process will be evolutionary rather than revolutionary, so long-term investment horizon is must. • Market cap is small (~$20bn domestic) but growing; still low market cap limits investabilty • Selling into highly regulated utility industry drives lumpy sales • Demand response aggregation opportunity alone could be $8bn annually in 5-10 years. Smart meters/AMI could be $8bn over the next few years, while hardware for demand response within AMI rollouts could be another $800mn. Addressable market for efficient HIF lighting retrofits in C&I is over $9bn. • Energy Management/ Efficiency: • -Comverge • -EnerNOC • -Microfield • -Orion Energy Systems • -PowerSecure • AMI Vendors: • -Badger • -Cooper • -Echelon • -Itron • Clean Coal/ Environmental Consulting • An attractive opportunity created by regulations regarding CO2, SOx and NOx reductions both in the U.S. and in developing countries.. • Domestic market cap < $20bn which limits investabilty • Addressable market is over $10bn globally for NOx/SOx reduction.Utility boiler efficiency improvement market through specialty chemicals is $3-5bn globally. • Companies in the space are profitable and often, products offered pay for themselves without government incentives. • Clean coal players: • -ADA-ES • -CECO Environmental--Evergreen Energy • -Foster Wheeler • -Fuel Tech • -Headwaters • -Peerless Mfg • -Rentech • Energy Storage • Battery/storage technology has remained relatively stagnant over the last 20 years. The lack of a reliable and economical high-energy density energy storage device has limited somewhat the potential of renewable energies such as wind and solar which generate electricity only during certain periods of the day, and fully electric vehicles. • Market cap < $10bn domestically limiting investability • Current development efforts focus on high energy density Li Ion batteries that do not catch fire, new nanotechnology-based solutions and ultra capacitors. • Energy storage players: • -Advanced Battery Technologies • -China BAK Battery • -Exide • -Lithium Technology • -Ultralife Batteries • Fuel Cells • Still a long way from commercialization and profitability. Efficient production of H2 still needed. • Valuation is difficult due to small order volumes, negative profits and lack of cash flow, small market caps • Current opportunities include materials handling ($6bn), portable electronics ($4.2bn), backup ($2bn) and residential cogeneration ($1bn). Automotive ($90bn) still several years away from being a reality. • Fuel Cell Producers: • Ballard Power Systems • -FuelCell Energy • -Hydrogenics • -Plug Power “Investability”
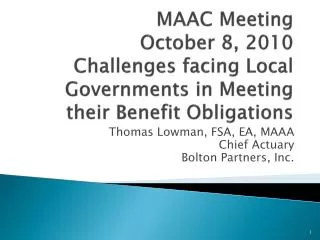
TWP Alternative Energy Coverage Small Cap (< $1 Bil) Mid Cap ($1-$10 Bil) Large Cap (>$10 Bil) Overweight Market Weight Underweight
Table of Contents • Solar • Demand Response / Energy Efficiency • Clean Fuels/Products Industry • Clean Coal • Fuel Cells
Summary of Opinions Solar – Best way to invest in alternative energy • Fast growing, profitable but eventually will be a very commoditized product • Focus on low cost producers (Asian or niche technology) in a declining price environment • Tight credit conditions not just in the U.S. but globally are pushing out project timelines, a majority of which are financed by debt. At the same time internal hurdle rates for system owners are increasing as appetite for risk decreases. • FSLR is our top pick in a tough market for solar stocks with lowest cost and committed output at pre-determined pricing. Long term winner best positioned to tap the U.S. utility scale market – see upside in late 2009-2010 • BTUI is a microcap play on next generation cell lines rolling out – strong momentum with STP and FSLR. • SOLR is a mid cap play on aggressive polysilicon and wafer capacity coming out of China – industry leading backlog of $1.5bn. Energy Efficiency / Demand Response - Attractive long-term secular trend • We see an attractive opportunity over the next three to five years to invest in companies that are saving energy as opposed to generating it and enabling the transformation of the power grid from 1960s technology to a modern, smart grid. • We expect this upgrade process to be evolutionary rather then revolutionary. As such, we think investors need to take a long term view when evaluating the sector • We believe demand response alone could be as large as $8 billion annually in the next 5–10 years • In this industry, we favor companies offering fully integrated energy solutions that are able to prove their cost effectiveness, while improving the product they are replacing. Clean Coal • Increasing regulation forcing coal plant to clean up their act • The US has the largest reserves of coal in the world so we find it unlikely the generation source will be replaced anytime soon. • We view solutions that provide extra value in the form of greater plant efficiency, safer operations, and less downtime as winners. • China and India could be large opportunities as operators • We expect the upgrade of coal plants to last five to 10 years, if not much longer. The opportunity is large but expect lumpy spending by utilities. Bio Fuels/Products – High commodity risk • Fast growing • Increasing liquidity concerns • Profits tied to volatile commodity prices (ethanol, corn, gasoline) • Minimal visibility into 2009 estimates • Favorable Public support, but debate increasing over true benefits and costs Fuel Cells – Still story stocks • Minimal growth; long way from profitability • Large percentage of ownership is retail based, stocks don’t always move on fundamentals • Still years away in most cases from being commercially viable • Valuation difficult to determine due to negative profits and lack of cash flow
Solar – High Risk, High Return Market Source: Matt Wuerker Source: Good Energies
Solar Industry • Solar – The best way to invest in alternative energy • Key Points • Demand in 2008 will be high, but investors are extrapolating near term trends for the long term view of the PV sector. My crystal ball is very fuzzy for 2009, so why should multiples expand? • We are concerned about a potential oversupply as early as 2009; the top 10 cell producers of 2007 alone plan for production of greater than our 5GW demand estimate. • Tight credit conditions are pushing out project timelines, a majority of which are funded by debt. Also as appetite for risk declines, internal hurdle rates for system owners are increasing. • Long term polysilicon prices will be higher than you think. • New polysilicon entrants in China are running behind, are not funded, and do not know what they are doing. • Upcoming regulatory changes in key markets create demand and pricing uncertainty exiting 2008 • UMG is a stop gap solution. The economics don’t make much sense with sub-$70 poly as best we can see it. • Rapid Commoditization will make low cost and high quality key; integrated business models likely to come out on top in short run. • The long term key investment opportunity lies with the solar capital equipment sector – those that are enabling the commoditization. If PV players beat each other up on price, capex budgets will go up more than 2x to 3x between now and 2010. We would also expect to see an upgrade cycle of lower quality early cycle equipment as well. • Near Term Market Running on Rails; We Are Nervous on 2009 as Demand Profile Unclear • 2008 – Firm markets dominated by German demand pull in (EEG Effect), Spain Bonanza (1 Year Grandfather Clause for approved projects), and Southern EU. U.S. market driven by state subsidies (CA, NJ,…) but pricing is tough due to FX movement and excess competition. Average ASPs for the industry in the $3.95-$4.40 range. • 2009 – Spain will more than halve in 2009 with lower cap compounded with FIT drop which will lead to lower IRRs, therefore we expect deceleration of the market. SunPower and QCells are highlighting Italy as the next Spain, but politics and bureaucracy have plagued PV thus far. If the ITC passes in the Energy Bill, US demand could pick up, but ASPs will be challenged. If ITC is delayed, we could see a very soft start to 2009. Likely average ASPs in the $3.50-$4.00 range. • 2010 – US likely a leading market, China and India?, Thin Film more pervasive. Emergence of the solar service provider (SunEdison, etc.), oversupply could be more pronounced
Our View from the Capital Markets – What is on Investor’s Minds? Main investor concerns: • Commodity Risk – Solar is rapidly commoditizing with several new entrants offering an undifferentiated product. When will the price of polysilicon fall and what will the ultimate clearing price be? • Demand Risk – The last 2 years have been driven by favorable subsidies by Spain and Germany; with those markets expected to slow who will fuel the growth in 2009? • Supply Risk – Excess returns created by favorable government programs and tight supply of polysilicon have pushed many new players into the solar field, especially in China. When these players are no longer restricted by the polysilicon shortage how much will they produce? Will think film startups hit their aggressive goals? Where will all the supply go? At what price? • Cloudy profit picture – Unstable polysilicon prices and uncertain module prices coupled with relatively short operating history leave investors guessing as to the long run business models in the solar space. • Credit Risk – Tight credit markets are pushing out project timelines and internal hurdle rates for system owners are increasing as appetite for risk decreases. LIBOR has increased >200bps from end of August, prompting further fears of module price erosion to make up for increased borrowing costs.
Solar Supply Chain Overview ** More of a matter of when than if, we believe when more polysilicon comes into the market the commoditization of the solar module will accelerate, compressing margins in the middle of the supply chain while benefiting the integrators and installers with scale and brand recognition and the equipment producers which enable more efficient production at the cell and module level. Source: SunPower and Thomas Weisel Partners LLC Limited Players High Barriers to Entry Capex Intensive - $500 mil - $1 bn High margins Numerous Players Low Barriers to Entry <$50 million gets you into business • Most loss of polysilicon occurs in the sawing process to make wafers – known as “kerf loss.” • Polysilicon, Ingot, and Wafer is becoming vertically integrated. • R&D focus surrounding less polysilicon consumption via thinner wafers and greater efficiencies. • Multiple Players – Suntech and SunPower as well as ~100 others • ~45% of the COGS of a solar module is in the polysilicon. • High barriers to entry, rising prices and margins. • Limited Players: MEMC, Wacker, REC, DC Chemical and Hemlock
Composition of Total Installed Cost per Watt – U.S. Residential/Small C&I Source: Wall Street Journal and Thomas Weisel Partners LLC estimates
Polysilicon continues to be main bottleneck • We estimate Polysilicon will make up 45% of the cost of a traditional solar cell in 2008. Investors have been focused on if and when new supplies will come online to reduce overall module cost and what the implications of that will be. • Spot market prices have been reported as high as $400/kg recently. • New polysilicon entrants need to price at an average of $60 or more to make up cost of capital; so silicon prices will remain well above long-term equilibrium levels. • Worries in polysilicon have moved to thin film production before full scale production has begun as investors question availability of Indium and Tellurium. Source: Company reports and Thomas Weisel Partners Estimates
Polysilicon Supply Source: Solarbuzz, Photon International, company reports, and Thomas Weisel Partners LLC
Metallurgical Silicon; Part of the Mix but Higher Long-term Cost Structure As Polysilicon Prices Ease Below $70 per kg • Cons: • Both CSIQ and QCE are using custom ingot machines – crystallization technique is not standard given high parts per million of boron and phosphorous. Expensive custom equipment is not what we need for an effective mass produced industry striving for low costs. • Efficiencies by Timminco are reported in the 11-14% range, QCell’s is indicating 15%. • Carrier lifetime – does anyone know how long these cells will really last? • Pros: • Cheap to add capacity – 10 to 20% of the cost of polysilicon. • Production costs are half of polysilicon – less energy intensive.
Major Plans for Poly Production Announced, But Where Will All The Funding Come From? Do They Know What They Are Doing? • The last 12-18 months large numbers of capacity announcements, especially from China. • Chinese government giving free or nearly free electricity to many polysilicon producers, saving $8-$12 per kg of cost. • Key risk is where and when TCS production will ramp up. Siberians are keeping more of it for themselves; Hoku admitted defeat and asked Suntech to bring their own. • There are ~60 proposed polysilicon plants, of which ~25-30 have broken ground. • A conservative estimate of announced new Chinese capacity coming online by 2010 is 100,000 metric tons – this implies capex of about $8-10bn. • New entrants are shooting for an avg. price of about $60-$65 per kg. • Some choosing flat rate pricing (Hoku). • Most choosing aggressive slope downward (Chinese). Quote from New Chinese Polysilicon Producer: “Polysilicon production is half art, half science. We have no artists.”
Polysilicon Production Process • What Do I Need To Manufacture My Own Polysilicon? • Investment Capital - $100,000 per MT – Typically $100 million to $600 million per plant. • Feedstock Gas – Extraordinary high purity levels – demands high level of technology and construction experience. • Reactor Technology – Decompose gas to solid, while maintaining purity levels – needs tight operational controls. • May are trying, the question is how many will succeed. There have been no new entrants in the market since 1985. • Fluidized Bed Reactor (FBR) process has 3 major advantages: • Low cost of production $25 vs. $30-$35 per kg due to less energy use. Production process gets up to 1,600 C in Siemens and 600 C in FBR. • Higher purity levels – less boron and phosphorous • Smaller size allows for maximization of crucible Source: GT Solar MEMC is about 75% FBR and 25% Siemens, REC and Wacker are trying to enter the FBR market. REC recently acknowledged that costs for FBR plant are running over budget.
Thomas Weisel PV Supply/Demand Model **Oversupply likely to happen in 2009 but likely to be priced in much sooner as high growth and lofty multiples force investors to look further into the future Source: Solarbuzz, Photon International, company reports, and Thomas Weisel Partners LLC
Upcoming regulatory changes in key markets create demand and pricing uncertainty exiting 2008 • Germany • 40% of the market, slow start to 2008 though because all modules are flowing into Spain. • Strong demand expected to year-end as customers are rushing to connect PV systems to the grid before 2009 reductions. • Lower house of parliament in June 2008 approved 8% FIT decline for rooftop installations in 2009 and 2010. For ground mount, the FIT decline is 10% in 2009 and 2010. From 2011, degression for all systems is 9% +/- 1%. Existing €0.05/kWh bonus for BIPV eliminated. Final vote in upper parliament is pending. • Module pricing would need to come down by 9-10% to maintain IRRs. • Spain • Spain was the story of 2007 and 2008, emerging from the woodwork with improved legislation that included a very rich FIT of €44 cents per kWh enabling IRRs in the region of 15%. Over 1500 MW currently hooked up to the grid today. • Bonanza of demand ahead of September 29th deadline before new FIT €29-31 cents for ground mount kicks in. On track to complete over 1200MW in 2008. • Spain is set to more than halve in 2009 with new 500MW cap. • Module pricing would need to come in by 45-50% to maintain current IRRs of 15%+. However, we believe a 15%-20% decline in pricing is more reasonable, bringing down systems IRRs to a more normalized 10%. • United States • The U.S. does not follow a performance-based FIT system like Europe, rather provides a one-time federal tax incentive of 30% of installed cost, uncapped for commercial installations and capped at $2,000 for residential. • The federal tax credit is scheduled to expire on Dec 31, 2008. An extension of the credit financed by the roll back of tax breaks to oil companies has already been vetoed by the President. • Commercial installations financed by PPAs have been driven primarily by tax credit hungry investors; with the expiration of the credit fast approaching we are seeing a slowdown in activity. • California (>70% of domestic market) with its own solar subsidy program is also slowing as state performance-based incentives decline in step with cumulative installations approved.
Overview of Solar Subsidy Programs • Solar demand is artificially created due to government subsidies. The most popular government inducement is called a “feed-in tariff,” in which investors and consumers are paid to sell power generated to the local electric utility at predetermined rates per watt. • We are most excited about Spain, Greece, and Italy. We note that Spain’s annual cap is very low and will need to be lifted in the next 12-18 months for the industry to continue to succeed there. Source: Schott Solar
Where Will All The Demand Come From? Source: Thomas Weisel Partners Estimates
In the U.S. State Renewable Portfolio Standards (RPS) Help Drive Renewable Energy Adoption In Addition To Federal Tax Incentives Source: Interstate Renewable Energy Council
March to Grid Parity – Solar Already At Grid Parity Depending on Definition of Grid Parity and Seasonal and Time of Use Rates Grid Parity On a Levelized Cost of Energy Basis Source: Thomas Weisel Partners LLC estimates So What is the Cost of Each Type of Generation For New Generating Assets?
East Coast and West Coast Showing Greatest Energy Cost Increases – Future Key Markets for Solar Evolving Source: Electric Power Monthly, DOE/EIA-0226; and Electric Power Annual, DOE/EIA-0346
Solar is Already Cost Competitive in Some States Today, And Will Be in More as Energy Prices Increase Nationwide • Applying conservative 4.7% inflationary rate (same as increase in national retail rates from 2002-07 per EIA), average US electricity prices will reach 16 c/kWh by 2015 • Rates in some states will be higher, with CT electricity prices forecast to reach 27 c/kWh in 2015 by the same logic c/kWh Year* *Estimates
2007 U.S. Residential PV and Electricity Price Differences (with existing incentives) Currently PV is financially competitive where there is some combination of high electricity prices, excellent sunshine and/or state/local incentives.
Power Generation Continues to Get More Expensive Recent Rate Increases California: + 39% since 2000 Colorado: + 20% in 2007 Connecticut: + 50% since 2004 Delaware: 59% increase in 2006 Hawaii: + 100% since 2002 Maryland: +85% through 2008 Massachusetts: + 40% since 2004 Nevada: + 25% since 2003 New Jersey: + 35% in 2007 New York: + 44% since 2001 Texas: +75% since 2000 Virginia: 30% increase in 2006 Source: SunEdison Increases in the price and volatility of fossil fuels continue to force utilities to raise rates
PPA driving commercial installations in U.S., but expiry of federal tax credit a near-term overhang • Buy solar power, not the system: PPAs remove the risk of installing a complicated, capital and time intensive solar system and the risk to the end user of actual power generated being less than expected. We expect the majority of commercial systems in the US to be installed in the future under some type of PPA. • In a PPA, a third party institutional investor group driven by an appetite for tax credits as well as IRR, finances the solar installation and maintenance and sells the power generated under a long-term, fixed price contract (pricing is generally competitive with grid power). The purchaser of power simply agrees to the use of their rooftop or land to host the solar system. • The PPA (power purchase agreement) financing model generally applied to traditional sources of energy, presents an alternative to direct ownership of a solar installation, and has caught on in a big way in the U.S, driven by the federal investment tax credit (30% of installed cost for C&I). Eg: SunPower has secured a $190mn credit facility from Morgan Stanley to finance future installations. • Equity investors are typically looking for IRRs in the 8-12% range while debt investors are looking for a solid credit profile and yields in the LIBOR+2.75-3.75% range. • Sweet spot of market is big box retailers. Publicized announcements include Costco, Kohls, Macys, Safeway, Staples, & Wal-Mart. • Expiration of investment tax credit at the end of the year poses a significant risk to commercial installations in the U.S. driven by PPAs. We are already seeing signs of a slowdown.
PV Cell Manufacturers – Multiple Players, Utilization Rates Low • Barriers to entry in cell manufacturing business are low, resulting in a more segmented market. • Number of competing firms has been increasing rapidly, as capital requirements are not prohibitive and financing for companies leveraged to the solar industry is abundant. • Any time companies that currently make 6-8% gross margins (Taiwanese PCB makers) enter your market and capital equipment is cheap and easy to add. • Equipment utilization rates are running at alarmingly low levels due to low barriers to entry and the silicon shortage. Source: PV News, Solarbuzz, and Thomas Weisel Partners LLC Source: Solarbuzz and Thomas Weisel Partners LLC
Rapid Commoditization; Low Cost and High Quality Key; Cell/Module Makers Get Squeezed • The solar panel is going the way of mass produced electronics equipment (DRAM, disk drives); distinguishable only on marginally better technology and reliability of the brand. • Low cost producers with integrated business models will fend off margin degradation. • Asian producers with their low cost models will ultimately win market share race but they are likely to sacrifice margins along the way as they have proven they are willing to do in the past • Cell/Module gross margins will trend toward 10-12% despite declining silicon costs in 2009. • Combined, China and Taiwan go from roughly 23% market share in 2006 to 41% by YE 2007. ? = Source: PV News and Thomas Weisel Partners LLC
Overview of Major Steps in Making a Solar Cell • It typically takes between 1.5 hours to 6 hours for a wafer to be converted to a finished module depending on the level of automation and inline metrology. Most players we have spoken to are aiming to produce between 2,400-3,000 cells per hour with many facilities still producing 1,500 cells per hour. • Wafers are the initial product needed in the multi-step process of producing solar cells based on silicon wafers. Silicon based solar cells made up about 93% of the total industry supply last year so this method is most prevalent. Before a wafer can be used, it must be tested to make sure that it can proceed with the solar cell production process. Wafers that are cracked, chipped, or have too much content of boron are typically rejected. • In the first production step, damage to the wafer that is a result of the sawing process is removed using a wet chemical etching process. After etching, the wafers are then cleaned using another wet chemical process and then dried. For the most part, the etching and cleaning is automated; however we have seen some Chinese facilities performing the cleaning part by hand, which can be quite dangerous to employees. • Phosphorous diffusion is the step performed next once a wafer has been cleaned and dried. In this step, the wafer is placed in a furnace and exposed to a gas containing phosphorous. The temperature inside the furnace gets up to 900C as oxygen is added, which causes a phosphorous oxide layer to form on the surface of the wafer inside the vacuum. Depending on the length of time the wafer is inside the diffusion vacuum and the temperature, the phosphorous diffuses into the silicon wafer at varying depths. An electrical field is formed within the wafer at the boundary of the areas within the wafer that contain phosphorous and the area that is without phosphorous atoms. It is this field that generates the electrical current within the wafer as it is exposed to sunlight. • The subsequent step is referred to as edge isolation, in which the electrical connection between the front and backside of the wafer is broken. It is at this point that the remaining phosphorous that remains on the wafer is removed with a wet chemical process. This phosphorous on the edge is referred to as phosphorous silicate. In addition, companies we spoke with cited the need for more inline metrology in this step to assure the homogeneity of the coating layer and assure there are no finger prints or water stains on the wafer. • After the edge isolation and wet chemical process to remove the phosphorous silicate, an anti reflective coating (AR Coating) is applied to the front of the wafer to reduce reflectivity of the solar cell and improve electrical properties on the surface of the wafer. This is a key step in improving efficiency of the solar cell. • After the AR Coating is applied to the wafer, the screen printing, or metallization process begins, by applying thin metal connectors on the front of the wafer. These metal connectors, typically silver, are referred to as “fingers.” The fingers go across the wafer horizontally and larger vertical connectors called “bus bands” connect the “fingers” together. Typically there are two fatter bus bars per wafer; however, some wafers contain three. Bus bars are also applied to the back of the wafer with a paste and then another printing step is performed with aluminum as well. After these printings, the wafer is dried in an oven. Once the wafer is completely dried out, a great deal of heat is applied to the contacts to sinter them into the wafer to fully connect them to the silicon in the wafer. These contacts are used to extract the electrical current from inside the wafer and connect them to the fingers so that it can be connected to other cells and laminated to make a complete module. Before a module can be made, the cells must be tested and sorted to determine their output so that the modules have cells with similar levels of efficiency.
Opportunity Lies in the Companies that are Enabling Commoditization; Equipment • Equipment typically makes up about 65-70% of the capex budget for cell/module producers. • The race to 1 GW of capacity by 2009 is leading to a bonanza for equipment companies. • Typical lead times remain in the 12-18 month range, with most industry participants telling us that down payments are 30-40% • Capex per watt for traditional silicon ingot, wafer, cells and modules is about $1.00-1.20 per watt. • Currently there is roughly 7 GW of cell production supply globally, with estimates of 2010 demand ranging from 7 GW on the low end to 23 GW on the high end. We believe demand will be in the 10 GW range. • Systems today are cobbled together with multiple suppliers but turnkey lines are becoming more pervasive as new players enter the market that know nothing about solar (Moser Baer, PCB players in Taiwan). • There are very few publicly traded equities in the solar capital equipment segment to date. With only a handful already public (Meyer Burger, Centrotherm, Roth & Rau, Manz Automation, BTU International, etc.), we expect a great deal of equity issuances in the segment over the next 12-18 months as many players capitalize on the near-term surge in demand. Traditional semi players are looking for a solar angle as well. Source: Thomas Weisel Partners Source: Prometheus Institute
Solar Equipment Supply Chain (Capex Assumes 300 MW Plant) Silicon Manufacturing Capital Expenditure = $450 M TCS Production Filament Production Silicon Reactors STC Converters Off Gas Recovery Product Handling • Degusssa • LX Engrg • SCC • GT Solar • MSA • PPP • Solmic • Beijing Design • CDI • GT Solar • MSA • PPP • GT Solar • Solmic • GT Solar Wafer Manufacturing Capital Expenditure = $270 M Inspection & Sorting Feed Stock Prep Ingot Growth Wafer Cleaning Slurry Recovery Sectioning Wafering • GT OEM • ALD • Crystalox • PVA Tepla • JFE • Daichi • Chinese Co’s. • HCT • Meyer+Burger • HCT • Meyer+Burger • Manz • Henneke • GT OEM • GT OEM • Rena • GT Solar • HCT • SiC Cell Manufacturing Capital Expenditure = $180 M Incoming Wafer Inspection Oxide Etching Nitride Deposition Screen Printing Sintering (Firing) Edge Isolation Testing & Sorting Etching Diffusion • Manz • Rena • Rena • Stangl • Schmid • BTU • Despatch • Centrotherm • SierraTherm • Amtech • Rena • Stangl • Schmid • Roth&Rau • Semco • Centrotherm • Applied Films • Amtech • Baccini • Asys • BTU • Despatch • RTC • Centrotherm • SierraTherm • Baccini • GT Solar • Manz • Baccini • OTB • Spire Module Manufacturing Capital Expenditure = $90 M Incoming Cell Inspection Tabbing & Stringing Prep Lamination Assembly Testing • Meier • Spire • NPC • 3S • Rena • Stangl • Schmid • Rena • Stangl • Schmid • Somot • T-Technik • Misc. Players
Energy Efficiency / Demand Response Industry • The power grid is under-invested and likely to remain so in the foreseeable future with electricity demand outgrowing investment in supply. Demand Response and Energy Efficiency are solutions A cheaper, quicker and “green” alternative to building new capacity is Demand Response i.e. the curtailment of energy consumption (when requested by utilities or grid operators) by end-users of electricity at times of peak demand. Electrical equipment such as air conditioning, lighting, motors, etc. can be switched off automatically through wireless or internet signals, thus providing virtual capacity in a few minutes. The demand response aggregator recruits program participants as an outsourced service provided to the utility or grid operator, and is paid based on the capacity committed and/or made available. The average payout from the utility is $80,000 per megawatt per year. The aggregator shares ~50% with the end-user who committed capacity. Typical contracts with utilities are 3-10 years with fixed prices and for capacity of 25-150 MWs. The aggregator recruits participants, installs the required hardware at the end-user site and is on standby 24/7 to deploy the committed capacity when called upon by the utility or grid operator during a grid event. The aggregator uses a paging, cellular or radio network to automatically send signals to shut down equipment. We view the Commercial and Industrial (C&I) segment of the end-user market as more lucrative and larger than the Residential segment – it can take 2-3 years to build out capacity in a residential program, but only 2-3 months for a C&I program since C&I end-users can offer much higher capacity. • Energy Efficiency, creating capacity by never using it: While demand response addresses peak capacity issues, energy efficiency has the potential to curb the growing demand for base load power generation. • On a business as usual case; investment in generation, transmission and distribution assets to meet required demand is expected to be $10 trillion between 2005 and 2030. Energy efficiency, especially in buildings, has a chance to supplant a meaningful proportion of the projected energy need. Buildings consume 40% of all energy in the United States and 72% of all the electricity produced; yields 38% of all carbon dioxide emissions and 36% of all greenhouse gas emissions; and accounts for 80% (or $238 billion) of total U.S. electricity expenditures. A 5% increase in building efficiency would translate to roughly 78 billion kW hours of electricity saved at 2005 levels, or roughly $5 billion at a national $0.06-0.07 per kW price. • The multidisciplinary nature of the industry will require products, installers and services to be effective. In the past, many consumers have been burned by promises of energy conservation that resulted in the acceptance of sub par products; such a scenario is unlikely to play out today. The need to prove energy savings will also likely lead to the need for whole building software and metering solutions, a segment we also feel will grow in the coming years. So, in this industry, we believe the companies most likely to succeed are those offering fully integrated energy solutions that are able to prove their cost effectiveness
Clean Fuels/Products Industry -Ethanol Industry- • Keys to Watch: • Producers have had major liquidity issues, a continued tight financial market could put ethanol producers in jeopardy. • Mid-Western flooding had caused concern for the corn supply but initial reports from the USDA show the situation might not be as dire as feared. At this point corn prices should continue weaken as we go into the fall. • Despite the improving corn costs, expectations should be tempered as low ethanol prices and infrastructure issues are likely to weigh on the stocks until investors get more certain clarity on industry dynamics exiting 2008. Cash corn prices are set to be well in the $5.00-6.00 range, which threaten to hurt results. We, however, are likely to see industry dynamics improving with falling corn costs and look for sustained ethanol pricing support to become more positive. • The bottom line is the 36bn gal Renewable Fuel Standard, which includes a very important 9bn gal biofuel mandate for 2008, is a positive, and we are cautiously optimistic as to the long-run viability of the biofuels industry. • On Going Issues In Ethanol • Commodity risk. Industry fortunes are tied to two volatile commodities, ethanol and corn. These factors limit earnings visibility. • Minimal “IP”. Commodity business with minimal technology differentiation. We believe ultimately results in price pressure and low margins. • The regulatory uncertainty: Government support remains key and a new RFS could provides support but supply could still outstrip regulated demand. • Minimal Visibility: Without the ability to see a long term price for ethanol, which a roughly 5 cent move in the price causes a roughly 5-10 cent move in EPS, we have minimal visibility into 2009. • The promise of cellulosic ethanol. Improvements in enzyme technology are required to meet long term ethanol production targets. Developers of these enzymes should have strong intellectual property position and therefore minimal commodity risk. (Most are private companies)
Ethanol Basics Wet-milling Ethanol Production Dry-Milling Ethanol Production Source: USDA Source: USDA • Ethanol is a type of alcohol primarily used as a blend component in the U.S. gasoline market. • Currently in the U.S. ethanol is primarily made from corn. Although a variety of feedstocks for ethanol production are under development, most production in the U.S. uses corn-based technology. Most of the corn supplied to the ethanol industry is grown in Illinois, Minnesota, Nebraska and South Dakota. • Corn is converted to ethanol with either dry or wet-milling technology. The primary difference between dry milling and wet milling is the pretreatment of the corn. In dry milling the corn is crushed as opposed to wet milling where it is soaked before processing. • Dry-milling accounts roughly 3/4 of ethanol production capacity and is employed in the majority of new production facilities due to lower capital costs than wet-milling and a higher ethanol yield. Dry-mill production yields roughly 2.7-2.8 gallons of ethanol and 15-17lbs of dry distilled grains (DDGS) at about $150-200/ton currently. • Wet-milling accounts for roughly 1/4 of production capacity (RFA) and has a higher yield of co-products and lower ethanol yield. The wet milling process has several outputs: a bushel of corn put through the wet milling process produces 2.5 gallons of ethanol, 1.5lbs of crude corn oil, 12.4lbs of gluten feed (livestock feed) and 3lbs of gluten meal (poultry feed). All of these products have viable markets.
US Ethanol Supply/Demand Analysis • We expect a more balanced supply/demand situation in 2008 as more difficult operating conditions (financing and high input prices) will make it tough for new entrances to succeed. • It now takes in the $100,000-$300,000 per day in working capital to support the corn requirements of a typical corn ethanol plant, start-ups and poorly funded plants will have trouble • We believe plant shutdowns and delayed/canceled construction will accelerate as we move further into 2008 Source: Company reports, USDA, Ethanol Producer Mag, DOE, and Thomas Weisel Partners LLC
Theoretical Ethanol Plant **Fully Depreciated and paid for plants with longer histories of operation will have an advantage in this low spread environment, creating barriers to entry in the industry. Source: Company reports and Thomas Weisel Partners LLC
Clean Fuels/Products Industry -Clean Coal- • Keys to Watch: • The U.S. air pollution control market is the primary driver in Fuel Tech’s NOx reduction technology segment. Domestic policy for coal can be traced back to 1970 with the implementation of the Clean Air Act. While increased regulation can increase the cost and complexity of running a coal plant, there are currently minimal viable substitutes to switch to that make economic sense. We view the current as well as future ‘clean coal’ regulations as major drivers of industry growth. • New requirements regarding carbon dioxide, nitrous oxide and mercury reductions are leading to an investment in performance improvement, while being environmentally friendly. • Industry Thesis • The United States has the largest coal reserves in the world, holding roughly a quarter of global supply. Scientists estimate that the United States has nearly 200 years worth of supply at current run rates. As a result, we do not look for coal plants to be shut down any time soon. We do, however, expect global policy to require capital expenditures to force coal facility owners to move to production methodologies that emit less pollution. The growth in consumption of coal over the last several years has largely been due to the rapid growth seen in China and India, where the bulk of new capacity additions have been coal based. • The idea of “Clean Coal” has been around for decades, but costs and lack of technology availability led to stagnant growth in the industry. As greater regulations enter the fray and greater awareness of green house gas emissions and global warming become a part of doing business, we expect to see a prolonged (a very prolonged in fact) upgrade cycle. Utilities do not move on a dime; we have seen that with Fuel Tech’s quarterly results as well as numerous other players focused on both the coal and broader utility market. We expect the upgrade of coal plants to last five to 10 years, if not much longer.
Fuel Cell Industry • The fuel cell industry faces many challenges before full-scale commercialization of the technology takes place. In our view, cost, durability, system size and heat recovery are all areas that need further development and improvement to make fuel cells a commercial reality. • Keys to Watch: • In response to increasing grid disruptions and the disarray that followed Katrina, the FCC on October 3, 2007, issued a ruling that within 12 months local exchange carriers (LEC) and commercial mobile radio (CMR) service providers file a certified emergency backup power compliance plan that describes how the LECs or CMRs provider will supply emergency backup power to 100 percent of non complaint assets in the event of a commercial grid power failure. A minimum of 24 hours of backup power is required for assets inside central offices and 8 hours for other assets including cell sites, remote switches and digital loop carrier system remote terminals. It also has a provision that requires CMRs and LECs to detail their monitoring of backup power capabilities to remain compliant. We believe this is a positive to fuel cells as its solution shows positive economics versus other backup solutions at about five hours. We believe this and the forklift market will be the largest near term market for fuel cells. • Technology validation in the form of large orders • Ongoing Industry Issues • Waning enthusiasm: Emergence of solar and alternative fuel sector has reduced investor attention on fuel cells. • Long road to Commercialization: Still waiting for commercial products. Will back up power or fork lifts be first markets? The fuel cell industry faces multiple challenges that must be overcome before full scale commercialization of the technology takes place. • Burn: Fuel cells companies still burning cash and some may run out in 07 • Valuation: Very difficult to value. • Technology not there yet: In our view, cost, durability, system size, and heat recovery are all areas that need further development and improvement to make fuel cells a commercial reality. • Efficient Hydrogen Production still needed: To truly create pollution-free fuel cells, hydrogen must be produced by renewable means and will likely take many years before reaching cost competitiveness. Hydrogen today for fuel cells uses more electricity than it saves.
Fuel Cell Basics • A fuel cell is an electrochemical device that converts chemical energy directly into electrical energy. Electricity is generated through a reaction in which oxygen and hydrogen combine to form water, along with heat that can be recovered and used. • A fuel cell is composed of three primary components: a fuel electrode (the anode), an oxidant electrode (the cathode), and an electrolyte in between the two electrodes. When hydrogen reaches the anode, an electrochemical reaction takes places, splitting the hydrogen molecules into protons and electrons. The protons can pass through the electrolyte, while the electrons are forced through an external circuit, allowing the energy to be captured as electricity. The protons and electrons rejoin at the cathode, where they react with oxygen to form water. Individual Fuel Cell Source: htttp://www.wikipedia.com Source: htttp://www.wikipedia.com