Download
1 / 28
400 likes | 2.26k Vues
By: Joanna Paredes Child Growth and Development University of Dallas. Children See…Children Do Observational Learning Theory: Albert Bandura. Albert Bandura. Born 1925 in Mundare, Alberta, Canada B.A. at University of British Columbia in 1949

E N D
By: Joanna Paredes Child Growth and Development University of Dallas Children See…Children DoObservational Learning Theory:Albert Bandura
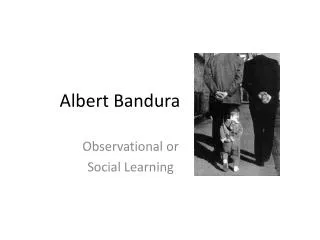
Albert Bandura • Born 1925 in Mundare, Alberta, Canada • B.A. at University of British Columbia in 1949 • M.A. and Ph.D. at University of Iowa in 1951 and 1952 • Specialized in Clinical Psychology • Stanford University Faculty in 1953 • Currently working there now • Influenced by Robert Spears & collaborated with Richard Walters • Wrote first book in 1959: Adolescent Aggression • Received: Guggenheim fellowship, American Psychological Association awards, James McKeen Cattell Award • President of APA in 1974 (trustee at 1975) • Leading spokesman for behavioristic movement in modern times
Bobo Experiment • Worked with Dorrie and Shiela Ross • Focused on social modeling • Children exposed to social models who expressed either violent or non violent behavior towards the Bobo dolls • Children exposed to violent behaviors exhibited aggression • Revealed the phenomenon of observational learning • found imitation to occur more often when rewarded rather than punished, when model has high status, when model is similar to child
Symbolic Models • Symbolic: • Oral, written instructions • Films, television, audiovisual displays • Actual instructor not always needed
Exemplary Models • Exemplary: • Live model • National heroes, villains, neighbors, family members • Reference to a model’s behavior and characteristics
Positive & Negative Exemplary • Positive Exemplary Model • Model’s behavior is told to be followed because it is considered good behavior • Negative Exemplary Model • Model’s behavior is told to be avoided because it is not considered good behavior
Observational Learning Theory • Combines behavioral and cognitive psychology • Attentional Processes • Retention Processes • Motor Reproduction Processes • Reinforcement and Motivational Processes
Attentional Processes • Model must be paid attention to • The value of the behavior being performed affects whether the behavior will be ignored or not • Status of model is important
Retention Processes • Behavior must be remembered in order to imitate • Images • Descriptive verbal symbols • Rehearsal • Those who use symbolic coding and rehearsal remember more than passive observers
Motor Reproduction Processes • To reproduce observed behavior: • Need necessary motor skills • Necessary cognitive development • Imitated behavior is limited based on motor skills and cognitive development
Reinforcement and Motivational Processes • Even if the model is… • Attentive to the model • Remembers the model’s behavior • Cognitively and physically capable of executing the behavior • DOES NOT MEAN the behavior will be imitated consequences of behavior is negative • Positive reinforcement encourages behavior and influences attention paid to model • Punishment discourages behavior
My Study To observe Bandura’s observational theory in 9-11 year old children
Critical Questions • If children are asked to draw a picture with certain criteria, are they more likely to include all the criteria if an example and list is given to them, or if they just receive a list of the criteria without an example picture? • Are children more likely to be more attentive to the researcher model or the peer model? • Will children imitate the placement, type, and/or quantity of the criteria when an example is shown?
Hypotheses • Children will include all criteria when given an example picture, verbal instructions, and a list of the criteria. • Children will draw the picture of the researcher model. • Children will imitate placement, type, and/or quantity of the objects in the model’s picture in their own picture
Population Sample & Setting • 21 students from Holy Family Nazareth School in Irving, Texas • Ages 9-11 years old • Conducted in a fourth grade classroom
Procedure • One child – peer model • 20 Children split up into two groups • Group 1 (9 children) • Verbal Instruction + Example Picture + List • Group 2 (9 children) • Verbal Instruction + List
Group 1 Researcher:Hi everyone! My name is Joanna and I have a small assignment for all of you. Jonathan and I will be showing and describing two different pictures. It will then be up to you to pick one of the pictures to draw. Peer: I want you to draw a picture of the beach. (SHOW EXAMPLE PICTURE) This is an example drawing of the beach. If you choose to draw this picture, please include: ocean, sand, a sandcastle, sun, clouds, one animal, and a palm tree. (PEER WRITES CRITERIA ON BOARD) Researcher:I want you draw a picture of the mountains. (SHOW EXAMPLE PICTURE) This is an example drawing of the mountains. If you choose to draw this picture, please include: mountains, trees, a log cabin, sun, clouds, one animal, and a pine tree. (RESEARCHER WRITES CRITERIA ON BOARD) Now it’s up to you to choose which picture you want to draw.
Mountain Mountains Trees Log Cabin Sun Clouds 1 Animal Pine Tree Beach Ocean Sand Sand Castle Sun Clouds 1 Animal Palm Tree * Criteria for Pictures *
Group 2 Researcher:Hi everyone! My name is Joanna and I have a small assignment for all of you. Jonathan and I will be showing and describing two different pictures. It will then be up to you to pick one of the pictures to draw. Peer: I want you to draw a picture of the beach. If you choose to draw this picture, please include: ocean, sand, a sandcastle, sun, clouds, one animal, and a palm tree. (PEER WRITES CRITERIA ON BOARD) Researcher:I want you draw a picture of the mountains. If you choose to draw this picture, please include: mountains, trees, a log cabin, sun, clouds, one animal, and a pine tree. (RESEARCHER WRITES CRITERIA ON BOARD) Now it’s up to you to choose which picture you want to draw.
2-Way Contingency Table by FREQUENCY| Group 1 | Group 2 | TOTAL ------------------------ Researcher | 7| 2| 9 ------------------------ Peer | 2| 7| 9 ------------------------ TOTAL 9 9 18 50.0 50.0 100.0 WARNING - Some Expected values less than 5. Chi-Square may not be valid. Statistic DF Value p-value ----------------------------------------------------------------- Chi-Square 1 5.556 0.019 Yates' Chi-Square 1 3.556 0.060 Fisher's Exact Test (one-tail) 0.028 (two-tail) 0.057 Phi Coefficient .556 Cramer's V .556 Contingency Coefficient .486 Relative Risk 3.500 Odds Ratio 12.250 Sensitivity .778 Specificity .778 Chi-Square #1
Mountain Criteria Beach Criteria Child’s Picture Mountains 1 pt Ocean 1 pt Trees 1 pt Sand 1 pt Log Cabin 1 pt Sand Castle 1 pt Sun 1 pt Sun 1 pt Clouds 1 pt Clouds 1 pt 1 Animal 1 pt 1 Animal 1 pt Pine Tree 1 pt Palm Tree 1 pt TOTAL = 7 pts TOTAL = 7 pts Criteria Included?
2-Way Contingency Table by FREQUENCY| Group 1 |Group 2 | TOTAL ------------------------ Included Criteria | 6 | 8 | 14 ------------------------ Omitted Criteria | 3 | 1 | 4 ------------------------ TOTAL 9 9 18 50.0 50.0 100.0 WARNING - Some Expected values less than 5. Chi-Square may not be valid. Statistic DF Value p-value ----------------------------------------------------------------- Chi-Square 1 1.286 0.257 Yates' Chi-Square 1 .321 0.571 Fisher's Exact Test (one-tail) 0.288 (two-tail) 0.576 Phi Coefficient .267 Cramer's V .267 Contingency Coefficient .258 Relative Risk .571 Odds Ratio .250 Sensitivity .667 Specificity .111 Sensitivity and Specficity calculations are based on 'True' being Chi-Square #2
Additional Observations… • Group 1 frequently asked questions • “Does this look ok?” • “What color do you want this?” • “Can I draw more than one animal?” • Group 1 took longer to draw than Group 2 • Many from Group 1 asked to redo their picture • “This looks messy.” • “This doesn’t look correct.” • Group 1 constantly asked for my approval of the picture
External & Internal Threats to Validity • Convenience Sampling • Small population sample • Children knew researcher and their major in psychology • Children knew researcher was friends with their teacher
Further Research… • Same study conducted with 5 year olds and 15 year olds • Same study conducted with children with a history of aggression against authoritative figures • One-on-one interview with the children