Download
1 / 30
300 likes | 537 Vues
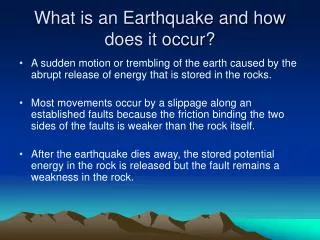
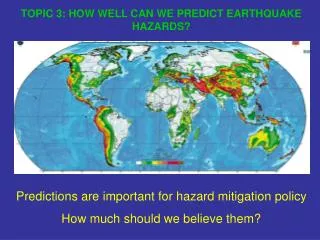
TOPIC 3: HOW WELL CAN WE PREDICT EARTHQUAKE HAZARDS?. Predictions are important for hazard mitigation policy How much should we believe them?. HAZARD ASSESSMENT IS HARD It has been described as "a game of chance of which we still don't know all the rules” Lomnitz, 1989

E N D
TOPIC 3: HOW WELL CAN WE PREDICT EARTHQUAKE HAZARDS? Predictions are important for hazard mitigation policy How much should we believe them?
HAZARD ASSESSMENT IS HARD It has been described as "a game of chance of which we still don't know all the rules” Lomnitz, 1989 AND WHAT GOES INTO A MAP IS OFTEN NOT EXPLAINED OR EXPLAINED BADLY Its "simplicity is deeply veiled by user-hostile notation, antonymous jargon, and proprietary software" Hanks and Cornell, 1994
Howis the hazard defined? Wheredo we expect earthquakes? When do we expect earthquakes? Whatwill happen in those earthquakes?
Howis the hazard defined? Hazard isn’t a physical thing we measure. It’s something mapmakers define on policy grounds. How they define hazard is the largest factor in determining the hazard. Different choices lead to different predicted hazards and thus favor different policies.
Algermissen et al., 1982 Hazard redefined from maximum acceleration predicted at 10% probability in 50 yr (1/ 500 yr ) to much higher 2% in 50 yr (1/2500 yr) Frankel et al., 1996
New Madrid hazard higher than California results largely from redefining hazard as largest shaking expected every 2500 yr: Not so for 500 yr 500 yr 2500 yr Searer & Freeman, 2002 500 yr 2500 yr
ASSUMED HAZARD DEPENDS ON DEFINITION TIME WINDOW Over 100 years, California site much more likely to be shaken strongly than NMSZ one Over 1000 years, more NMSZ sites shaken strongly once; many in California shaken many times Short time relevant for buildings with 50-100 yr life Shaken areas MMI > VII Random seismicity simulation including seismicity & ground motion differences
Wheredo we expect earthquakes? Can use Earthquake history Plate motions Geology GPS On plate boundaries, these agree. In other places, we have to chose which to use Different choices lead to different predicted hazards
Long record needed to see real hazard 1933 M 7.3 1929 M 7.2 Swafford & Stein, 2007
Map depends greatly on assumptions & thus has large uncertainty GSC 1985 Concentrated hazard bull's-eyes at historic earthquake sites “Our glacial loading model suggests that earthquakes may occur anywhere along the rifted margin which has been glaciated.” Stein et al., 1979 2005 Diffuse hazard along margin
HUNGARY: ALTERNATIVE HAZARD MAPS Present Study Peak Ground Acceleration10% probability of exceedance in 50 years(once in 500 yr) Diffuse hazard inferred incorporating geology GSHAP (1999) Concentrated hazard inferred from historic seismicity alone Toth et al., 2004
When do we expect earthquakes? When we have a long history, we can estimate the average recurrence time - but there’s a lot of scatter When we have a short history, we estimate the recurrence time of large earthquakes from small ones, but this can be biased In either case, we have to assume either that the probability of large earthquakes stays constant with time, or that it changes Different choices lead to different predicted hazards
EARTHQUAKE RECURRENCE IS HIGHLY VARIABLE Sieh et al., 1989 Extend earthquake history with paleoseismology M>7 mean 132 yr s 105 yr Estimated probability in 30 yrs 7-51%
When we have a long history, we can estimate the average recurrence time - but there’s a lot of scatter Mean 132 105 Mean 180 72 We can describe these using various distributions - Gaussian, log-normal, Poisson but it’s not clear that one is better than another
When we have a short history, we estimate the recurrence time of large earthquakes from small ones, but this can be biased Gutenberg-Richter relationship log10 N = a -b M N = number of earthquakes occurring ≥ Ma = activity rate (y-intercept)b = slope M = Magnitude
POSSIBLE BIASES IN ESTIMATING THE MAGNITUDE AND RECURRENCE TIME OF LARGE EARTHQUAKES FROM THE RATE OF SMALL ONES Undersampling: record comparable to or shorter than mean recurrence - Usually find too-short recurrence time. Can also miss largest events CHARACTERISTIC UNCHARACTERISTIC Earthquake Rate Direct paleoseismic study: Magnitude overestimated, recurrence underestimated Events missed, recurrence overestimated Stein & Newman, 2004
SIMULATIONS 10,000 synthetic earthquake histories for G-R relation with slope b=1 Gaussian recurrence times for M> 5, 6, 7 Various history lengths given in terms of Tav, mean recurrence for M>7 Short history: often miss largest earthquake or find a too-short recurrence time Stein & Newman, 2004
Long history: Can still find too-short or too-long recurrence time Stein & Newman, 2004
RESULTS VARY WITH AREA SAMPLED Increasing area around main fault adds more small earthquakes Stein et al., 2005
ASSUMED HAZARD DEPENDS ON EARTHQUAKE PROBABILITY ASSUMPTION Constant since last event: time independent (can’t be “overdue”) Small after last event, then grows: time dependent Time dependent lower until ~2/3 mean recurrence Details depend on model & parameters Hebden & Stein, 2008
RELATIVE PREDICTED HAZARD DEPENDS ON POSITION IN EARTHQUAKE CYCLE Time dependent lower until ~2/3 mean recurrence Charleston & New Madrid early in their cycles so time dependent predicts lower hazard Southern San Andreas broke in 1857 M 7.7 Fort Tejon, late in cycle so time-dependent predicts higher hazard (“overdue”) Hebden & Stein, 2008
California Time-dependant probabilitiesIncreased on southern San Andreas
CHARLESTON At present, time dependent predicts ~50% lower hazard Still less in 2250 2% in 50 yr (1/2500 yr) Hebden & Stein, 2008
Whatwill happen in large earthquakes? Major unknowns are magnitude of the earthquake and the ground shaking it will produce Tradeoff between these two parameters Different choices lead to different predicted hazards
EFFECTS OF ASSUMED GROUND MOTION MODEL Effect as large as one magnitude unit Frankel model predicts significantly greater shaking for M >7 Frankel M 7 similar to other models’ M 8 Newman et al., 2001
Assumed maximum magnitude of largest events has largest effect near main fault Assumed ground motion model has regional effect because it also applies to small earthquakes off main fault Newman et al., 2001
When we look at a hazard map, remember that it is just one of a large number of quite different and equally likely maps one could make, depending on model assumptions Howis the hazard defined? Wheredo we expect earthquakes? When do we expect earthquakes? Whatwill happen in those earthquakes? Often the last (Mmax, ground motion model) is discussed the most but the other assumptions are more important
Comparing maps made for different assumptions shows which features are best constrained (robust)
We use these maps, but It’s hard to say how good they are Won’t know for 100s or 1000s of years, when we have enough experience to see how good their predictions were. Where the data are good, the assumptions and thus predictions are probably pretty good. Where the data are poorer, the predictions are probably poorer. Our best bet is probably to look at any given map, ask whether the prediction makes sense, and act accordingly.
New Madrid: 200 years into hypothesized 500 year recurrence Time independent vs. Time dependent Large uncertainty in maps 54% effect in Memphis %106 154% 2% in 50 yr (1/2500 yr)