
Analyzing 10-Year DOW and S&P 500 Indices Performance from 2004 to 2013

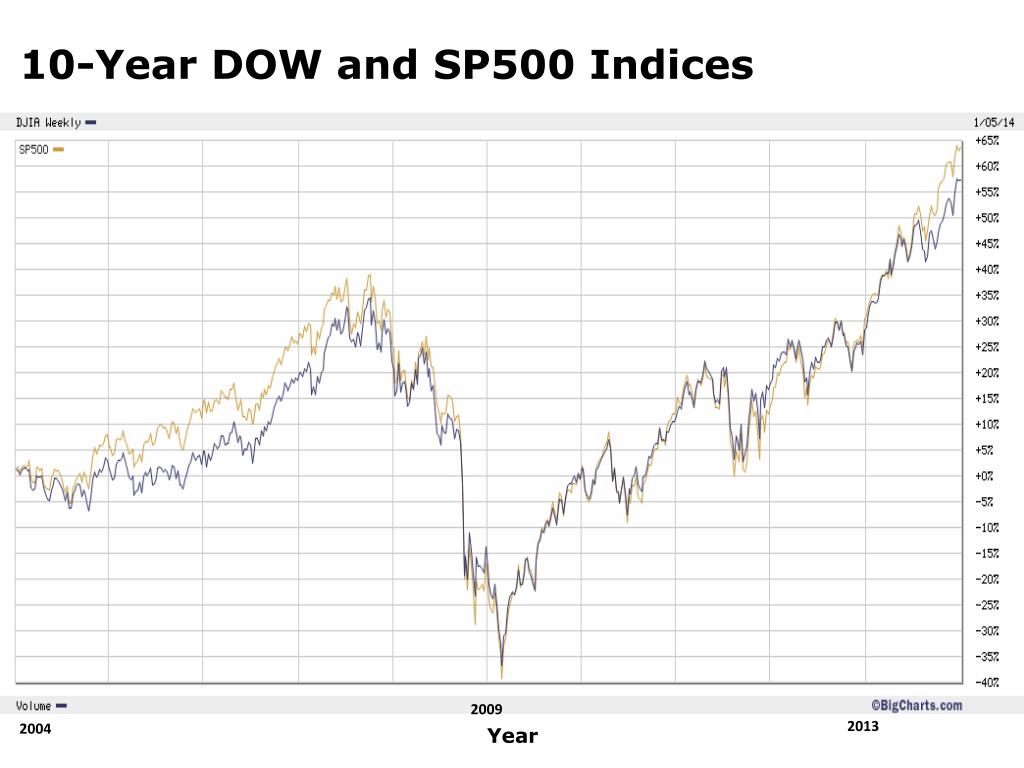
This comprehensive analysis explores the performance of the DOW and S&P 500 indices over a decade, focusing on the trends, fluctuations, and key events from 2004 to 2013. Emphasizing the impact of economic conditions, major market events, and recovery patterns post-2008 financial crisis, this study provides valuable insights for investors and analysts. By examining historical data, we aim to highlight the relationship between these indices and broader economic indicators, offering a clearer understanding of market dynamics during this period.
Télécharger la présentation 
Politique de téléchargement : le contenu du site vous est fourni TEL QUEL pour votre information et votre usage personnel ; il ne peut être vendu, concédé sous licence ni partagé sur d’autres sites sans l’accord de son auteur.Le contenu vous est fourni TEL QUEL, pour votre information et votre usage personnel uniquement. Téléchargez la présentation en cliquant sur ce lien. Lors du téléchargement, si vous ne parvenez pas à télécharger une présentation, l’éditeur a peut-être supprimé le fichier de son serveur.Pendant le téléchargement, si vous ne parvenez pas à obtenir une présentation, le fichier a peut-être été supprimé par l’éditeur.
F I N