Download
1 / 10
100 likes | 266 Vues
Forced Outages in Genesys. Examining the overall and individual outages for thermal generating resources. FOR in Genesys. The user provides the forced outage rate and the mean repair time for individual thermal generating resources

E N D
Forced Outages in Genesys Examining the overall and individual outages for thermal generating resources
FOR in Genesys • The user provides the forced outage rate and the mean repair time for individual thermal generating resources • The individual resources can be set for zero outages, non-stochastic outages (reduction applied to every hour) or stochastic outages • Zero outages and non-stochastic outages can be helpful for other study purposes
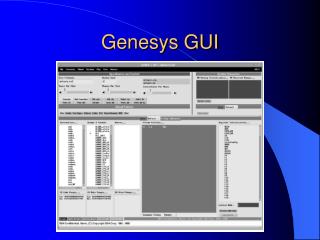
FOR in Genesys output • FOMW = number of MW that are not available due to forced outages • PerFO = percent of the thermal stack that is not available due to forced outages -- adjusted if availability of a resource goes to zero due to monthly distribution factors (e.g. maintenance outages during certain months) • Reliability record output includes FOMW and PerFO for curtailment hours, and the user can choose to output FOMW and PerFO for all hours simulated
Stochastic FOR • The user-defined FOR and mean repair time (MTTR) are used to calculate the hours until failure (MTTF) • Each resource has an initial outage “state” -- operating or experiencing an outage, based on random draw • Number of hours until subsequent states depends on additional random draws combined with either the user-defined MTTR or MTTF
Stochastic FOR • For any resource, some games might not have any outages, while in other games there may be many outages, and for varied amounts of time • Investigating whether actual FOR of a resource over many games is comparable to the user-entered FOR
Stochastic FOR • Studying Columbia Generating Station • Using a maximum output of 1160 MW • User-entered FOR = 5%, MTTR = 200 hrs • 1000 game run, one run included a refueling outage, another run omitted the refueling outage • Average FOR in terms of MW = 5.95% • Average output 1091 MW, (1-(1091/1160)) = 0.0595 • Average FOR in terms of hours = 5.97% (w/o refuel), 6.15% (w/refuel, adjusting total hours simulated) • 522990 downtime hrs / 8760000 total hrs = 0.0597 • 448773 downtime hrs / 7296000 total hrs = 0.0615
Repair hours vs. random number draw Number of repair hours is a function of a random draw. With a user-defined MTTR of 200 hours, over 100 draws the mean repair hours comes out to 194. Over 1000 draws it comes out to 199, and over 10000 draws the mean of the repair hours is 199.9 – more draws brings you closer to the user-defined MTTR
Stochastic FOR • With larger FOR (e.g. experimented with 50% FOR, but did not change MTTR), the user-entered FOR and the actual FOR over 1000 games is very close • With smaller user-entered FOR (1% - 5%), actual FOR coming out to be 2% - 6% • Could run more games to converge