Statistical Analysis of Laboratory Data: Benzene and Zinc Measurement
Analyze statistical parameters for benzene detection in blood and zinc measurement in water using regression analysis. Explore confidence intervals and detection limits. References for further reading provided.

Statistical Analysis of Laboratory Data: Benzene and Zinc Measurement
E N D
Presentation Transcript
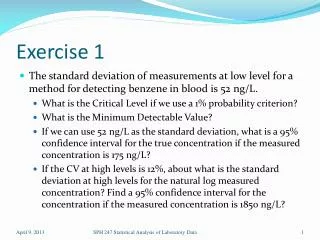
Exercise 1 • The standard deviation of measurements at low level for a method for detecting benzene in blood is 52 ng/L. • What is the Critical Level if we use a 1% probability criterion? • What is the Minimum Detectable Value? • If we can use 52 ng/L as the standard deviation, what is a 95% confidence interval for the true concentration if the measured concentration is 175 ng/L? • If the CV at high levels is 12%, about what is the standard deviation at high levels for the natural log measured concentration? Find a 95% confidence interval for the concentration if the measured concentration is 1850 ng/L? SPH 247 Statistical Analysis of Laboratory Data
Exercise 2 • Download data on measurement of zinc in water by ICP/MS (“Zinc.csv”). Use read.csv() to load. • Conduct a regression analysis in which you predict peak area from concentration • Which of the usual regression assumptions appears to be satisfied and which do not? • What would the estimated concentration be if the peak area of a new sample was 1850? • From the blanks part of the data, how big should a result be to indicate the presence of zinc with some degree of certainty? SPH 247 Statistical Analysis of Laboratory Data
References • Lloyd Currie (1995) “Nomenclature in Evaluation of Analytical Methods Including Detection and Quantification Capabilities,” Pure & Applied Chemistry, 67, 1699–1723. • David M. Rocke and Stefan Lorenzato (1995) “A Two-Component Model For Measurement Error In Analytical Chemistry,” Technometrics, 37, 176–184. • MachelleWilson, David M. Rocke, Blythe Durbin, and Henry Kahn (2004) “Detection Limits And Goodness-of-Fit Measures For The Two-component Model Of Chemical Analytical Error,” AnalyticaChimicaActa, 509, 197–208. SPH 247 Statistical Analysis of Laboratory Data