Download
1 / 114
1.18k likes | 2.06k Vues
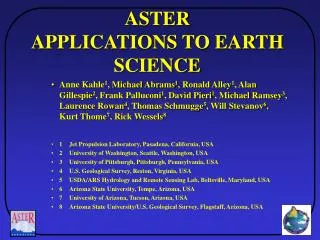
ASTER APPLICATIONS TO EARTH SCIENCE. Anne Kahle 1 , Michael Abrams 1 , Ronald Alley 1 , Alan Gillespie 2 , Frank Palluconi 1 , David Pieri 1 , Michael Ramsey 3 , Laurence Rowan 4 , Thomas Schmugge 5 , Will Stevanov 6 , Kurt Thome 7 , Rick Wessels 8

E N D
ASTERAPPLICATIONS TO EARTH SCIENCE • Anne Kahle1, Michael Abrams1, Ronald Alley1, Alan Gillespie2, Frank Palluconi1, David Pieri1, Michael Ramsey3, Laurence Rowan4, Thomas Schmugge5, Will Stevanov6, Kurt Thome7, Rick Wessels8 • 1 Jet Propulsion Laboratory, Pasadena, California, USA • 2 University of Washington, Seattle, Washington, USA • 3 University of Pittsburgh, Pittsburgh, Pennsylvania, USA • 4 U.S. Geological Survey, Reston, Virginia, USA • 5 USDA/ARS Hydrology and Remote Sensing Lab, Beltsville, Maryland, USA • 6 Arizona State University, Tempe, Arizona, USA • 7 University of Arizona, Tucson, Arizona, USA • 8 Arizona State University/U.S. Geological Survey, Flagstaff, Arizona, USA
ASTER Advanced Spaceborne Thermal Emission and Reflection Radiometer
ASTER high spatial resolution observations from the visible through the thermal infrared spectral regions are being used to study: • Surface properties such as temperature, emissivity, and reflectivity • Elements of the surface heat balance including radiative, sensible, and latent heat fluxes as inputs to models of the global energy and climate systems • Evapotranspiration and hydrology • Glacier extent, velocities, and changes • Volcanoes, including eruption monitoring • Geology and topography of the land surface • Coral reefs and coastal processes • Patterns of vegetation, land use, and surface change • Sea ice extent and albedo and the areas of open leads and meltponds • Hazard monitoring, including wild fires, landslides, flooding • Urban monitoring
ALGORITHM DEVELOPMENT • Science algorithm selected by appropriate working group (joint U.S./Japanese) • Algorithm developer creates prototype software • Product generation group builds operational software • Software installed at DAAC (EDC) • Developer validates, modifies, updates • Example: MODIS and MISR atmospheric data now in process of being incorporated
DECORRELATION STRETCHRonald Alley, Jet Propulsion Laboratory • Available for each telescope separately • Enhances spectral differences by removing interband correlation • Used as browse for selecting suitable scenes for further research
321 321 DST 468 DST 131210 DST
BRIGHTNESS TEMPERATURERonald Alley, Jet Propulsion Laboratory • Apparent temperature, assuming a surface emissivity, with no atmospheric correction • Used to observe volcanoes, fire, ice leads, etc. • Used for cloud top temperatures, which are excluded from surface radiance calculations
SURFACE RADIANCE VNIR & SWIR Kurt Thome, University of Arizona • Algorithm uses RTC to correct at satellite radiance to surface radiance • Method assumes atmospheric properties are known from other sources, e.g., satellite sensor data, ground based measurements, climatology
SURFACE RADIANCE TIRFrank Palluconi, Jet Propulsion Laboratory • Algorithm uses RTC to correct at satellite radiance to surface radiance • Method assumes atmospheric properties are known from other sources, e.g., satellite sensor data, ground based measurements, climatology
ASTER Level 2 Data Product AST 09T “Surface Leaving Radiance” And “Sky Irradiance”: Lake Tahoe 27 February 2002 Example Surface Leaving Radiance: (W/m2/sr/µm) Sky Irradiance: (W/me/µm) Band 13
TEMPERATURE/EMISSIVITYSEPARATIONAlan Gillespie, University of Washington, Shuichi Rokugawa, Tokyo University • Algorithm • Combination of alpha residual and MMD algorithms • Accuracy • 1-2K and 0.01-0.02 emissivity units
ASTER DEMMichael Abrams, Jet Propulsion Laboratory • Relative or absolute • 30 m postings • Produced from Level 1A 3N and 3B images • Created at EDCDAAC through EDG tool
3-D Perspective View to NW along San Andreas Fault near San Bernardino CA
ASTER POLAR CLOUD MASKRon Welch, University of Alabama in Huntsville • Neural network based supervised classifier • Accuracy > 90% for cloud detection • Also applicable to nonpolar imagery
Classifier Results for GreenlandJuly 30, 2000 RGB Color Composite Classifier Result Image Red: Ch 14 grey flippedGreen Ch 4Blue Ch 1All Channels histogram equalized Blue – water Green – land White – snow/ice Orange – water cloud
Classifier Results for Siberia, RussiaOctober 8, 2000 RGB Color Composite Classifier Result Image Green – land White – snow/ice Orange – water cloud Pink – cirrus Grey – shadow Red: Ch 14 grey flippedGreen Ch 4Blue Ch 1All Channels histogram equalized
Validation Results for Barrow AK ARM SiteApril 22, 2002 RGB Color Composite Cloud Cover Validation Results ASTER Polar Cloud Mask 1% Whole Sky Imager 1% Vaisalla Ceilometer 1% Red: Ch 14 grey flippedGreen Ch 4Blue Ch 1 • Circled area is 15km radius around Barrow ARM site • +/- 15 minute time average used for Vaisalla Ceilometer
Validation Results for Barrow AK ARM SiteApril 21, 2001 RGB Color Composite Cloud Cover Validation Results ASTER Polar Cloud Mask 62% Whole Sky Imager 72% Vaisalla Ceilometer 88% Red: Ch 14 grey flippedGreen Ch 4Blue Ch 1 • Circled area is 15km radius around Barrow ARM site • +/- 15 minute time average used for Vaisalla Ceilometer
APPLICATIONS • Surface Energy Balance • Geology • Wild Fires • Urban Monitoring • Glacial Monitoring • Volcano Monitoring • Wetland Studies • Land Use
Surface Energy Balance from ASTER data El Reno OK, 4-Sep-2000, Kustas & Norman 2-source model
ASTER data of El Reno OK, 4-Sep-2000: NDVI & Surface Temperature
Daytime (7/10) Nighttime (9/17) NDVI NDVI Surface Temp.(℃) Surface Temp.(℃) Relation between Surface Temperature & NDVI
Kunlun Fault, Tibet showing left-lateral strike slip displacement
Tonopah West-central Nevada ASTER SWIR 4-6-8 RGB saturation stretched Goldfield Cuprite
ASTER 4-6-8 RGB saturation stretch Goldfield Cuprite Tonopah
ASTER SWIR data for Cuprite classified using Spectral Angle Mapper
ASTER TIR Cuprite, NV Night TIR Bands 13-12-10 RGB Dstretch Day TIR Bands 13-12-10 RGB saturation stretch