0.01
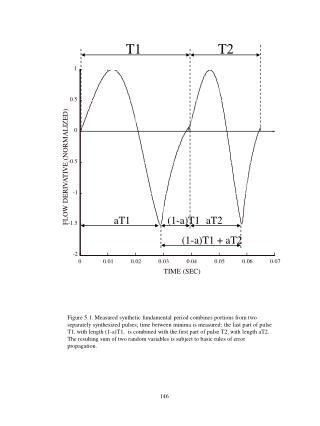
T1. T2. 1. 0.5. 0. -0.5. FLOW DERIVATIVE (NORMALIZED). -1. aT1. (1-a)T1. aT2. -1.5. (1-a)T1 + aT2. -2. 0. 0.01. 0.02. 0.03. 0.04. 0.05. 0.06. 0.07. TIME (SEC).

0.01
E N D
Presentation Transcript
T1 T2 1 0.5 0 -0.5 FLOW DERIVATIVE (NORMALIZED) -1 aT1 (1-a)T1 aT2 -1.5 (1-a)T1 + aT2 -2 0 0.01 0.02 0.03 0.04 0.05 0.06 0.07 TIME (SEC) Figure 5.1.Measured synthetic fundamental period combines portions from two separately synthesized pulses; time between minima is measured: the last part of pulse T1, with length (1-a)T1, is combined with the first part of pulse T2, with length aT2. The resulting sum of two random variables is subject to basic rules of error propagation.
0.105 0.1 0.095 0.09 ACTUAL STD: O=MONTE CARLO, LINE = PREDICTED 0.085 0.08 0.075 0.07 0 0.2 0.4 0.6 0.8 1 ALPHA (NEG PEAK POSITION IN CYCLE Figure 5.2 . Simulation demonstrating the effect of fundamental peak position on standard deviation of measured fundamental period length. Circles show average simulated result using 100,000 random pulses. Line shows predicted values.
0 -5 -10 -15 MEASURED NSR IN SYNTHETIC (dB) -20 -25 -30 -30 -25 -20 -15 -10 -5 0 A.N. SET NSR IN SYNTHESIZER (dB) Figure 5.3. Verification of NSR level in synthesized voice. Aspiration noise (AN) levels programmed predict measured levels within about 1 dB.
2 1.8 1.6 1.4 1.2 HFPV IN SYNTHETIC VOICE WITH ASPIRATION(%) 1 0.8 0.6 0.4 0.2 0 0 0.5 1 1.5 2 HFPV IN SYNTHETIC VOICE WITHOUT ASPRIATION (%) Figure 5.4. Effect of AN on measured HFPV in the synthetic voice. Horizontal axis is programmed HFPV level. Vertical axis is HFPV measured in synthetic voice when the original measured level of AN is added. AN seems to add about 0.2% to the HFPV measurement for the levels found in the voice set.
0 -5 -10 -15 NSR IN SYNTHEITIC VOICE WITH HFPV (dB) -20 -25 -30 -30 -25 -20 -15 -10 -5 0 NSR IN SYNTHETIC VOICE WITHOUT HFPV (dB) Figure 5.5 Effect of HFPV on measured NSR in the synthetic voice. Horizontal axis is programmed AN level. Vertical axis is measured NSR in the synthetic voice when the original measured level of HFPV is added. HFPV seems to add about a 4 dB increment in NSR for the levels found in the voice set. Dashed line shows best linear fit.
0 ORIGINALVOICE -5 PEARSON = 0.51 -10 -15 SABS LISTENER-SET ASPIRATIONN NOISE (dB) -20 -25 -30 -30 -25 -20 -15 -10 -5 0 MEASURED NSR (dB) Figure 5.6. Mean of listener-set aspiration noise in SABS experiments versus the measured original NSR. The listeners set AN levels 5 - 10 dB below measured, indicating original NSR includes more than AN effects. Dashed line shows best linear fit.
0 TREMOR REMOVED -5 PEARSON = 0.71 -10 -15 SABS LISTENER-SET ASPIRATION NOISE (dB) -20 -25 -30 -30 -25 -20 -15 -10 -5 0 MEASURED NSR (dB) Figure 5.7. Mean of listener-set aspiration noise in SABS experiments versus NSR of voices with tremor removed. Agreement between SABS and measured NSR improves over Fig. 5.6. Dashed line shows best linear fit.
0 ALL AM&FM REMOVED -5 PEARSON = 0.87 -10 SABS LISTENER-SET ASPIRATION NOISE (dB) -15 -20 -25 -30 -30 -25 -20 -15 -10 -5 0 MEASURED NSR (dB) Figure 5.8. Mean of listener-set aspiration noise in SABS experiments versus NSR of voices with all AM and FM removed. Agreement between SABS and measured NSR improves further over Fig. 5.6. Dashed line shows best linear fit.
3 SABS HFPV 2.5 PEARSON = 0.40 2 SABS LISTENER-SET HFPV (%) 1.5 1 0.5 0 0 0.5 1 1.5 2 2.5 3 MEASURED HFPV (%) Figure 5.9. SABS comparison of user set HFPV versus measured HFPV. Weak correlation indicates listener difficulty perceiving HFPV at the levels present in the voice set.