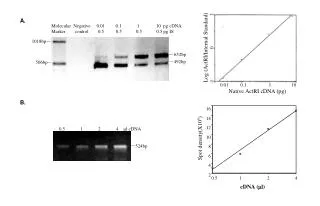
Analysis of Proportional Changes in NUPT Length of Chloroplast Regions
This study investigates the proportion of change in Nuclear-encoded plastid genes (NUPT) length of original chloroplast regions, analyzing data represented through a variety of supplemental figures. The research applies statistical analysis methods to understand the variability and patterns in NUPT length changes, contributing to the understanding of chloroplast genome evolution. The findings may have significant implications for plant genetics and evolutionary biology.
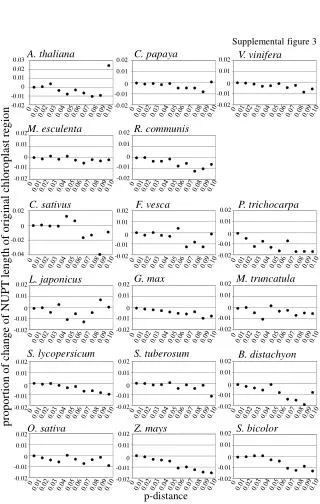

Analysis of Proportional Changes in NUPT Length of Chloroplast Regions
E N D
Presentation Transcript
Supplemental figure 3 0.02 0.01 0 -0.01 -0.02 0.03 0.02 0.01 0 -0.01 -0.02 0.02 0.01 0 -0.01 -0.02 0.02 0.01 0 -0.01 -0.02 0.02 0.01 0 -0.01 -0.02 0.02 0.01 0 -0.01 -0.02 0.02 0 -0.02 -0.04 0.02 0.01 0 -0.01 -0.02 proportion of change of NUPT length of original chloroplast region 0.02 0.01 0 -0.01 -0.02 0.02 0.01 0 -0.01 -0.02 0.02 0.01 0 -0.01 -0.02 0.02 0.01 0 -0.01 -0.02 0.02 0.01 0 -0.01 -0.02 0.02 0.01 0 -0.01 -0.02 0.02 0.01 0 -0.01 -0.02 0.02 0.01 0 -0.01 -0.02 0.02 0.01 0 -0.01 -0.02 0 0 0 0 0 0 0 0 0 0 0 0 0 0 0 0 0 0.09 0.09 0.09 0.09 0.09 0.09 0.10 0.10 0.10 0.10 0.10 0.10 0.01 0.01 0.01 0.01 0.01 0.01 0.02 0.02 0.02 0.02 0.02 0.02 0.03 0.03 0.03 0.03 0.03 0.03 0.04 0.04 0.04 0.04 0.04 0.04 0.05 0.05 0.05 0.05 0.05 0.05 0.06 0.06 0.06 0.06 0.06 0.06 0.07 0.07 0.07 0.07 0.07 0.07 0.08 0.08 0.08 0.08 0.08 0.08 0.09 0.09 0.09 0.09 0.09 0.09 0.10 0.10 0.10 0.10 0.10 0.10 0.01 0.01 0.01 0.01 0.01 0.01 0.02 0.02 0.02 0.02 0.02 0.02 0.03 0.03 0.03 0.03 0.03 0.03 0.04 0.04 0.04 0.04 0.04 0.04 0.05 0.05 0.05 0.05 0.05 0.05 0.06 0.06 0.06 0.06 0.06 0.06 0.07 0.07 0.07 0.07 0.07 0.07 0.08 0.08 0.08 0.08 0.08 0.08 0.09 0.09 0.09 0.09 0.09 0.10 0.10 0.10 0.10 0.10 0.01 0.01 0.01 0.01 0.01 0.02 0.02 0.02 0.02 0.02 0.03 0.03 0.03 0.03 0.03 0.04 0.04 0.04 0.04 0.04 0.05 0.05 0.05 0.05 0.05 0.06 0.06 0.06 0.06 0.06 0.07 0.07 0.07 0.07 0.07 0.08 0.08 0.08 0.08 0.08 p-distance