SlideServe
Menu
Préférences
© SlideServe · v2026

Network Flow Back Flow

adora avatar
8 diapositives · 360 Views · Sep 03, 2014

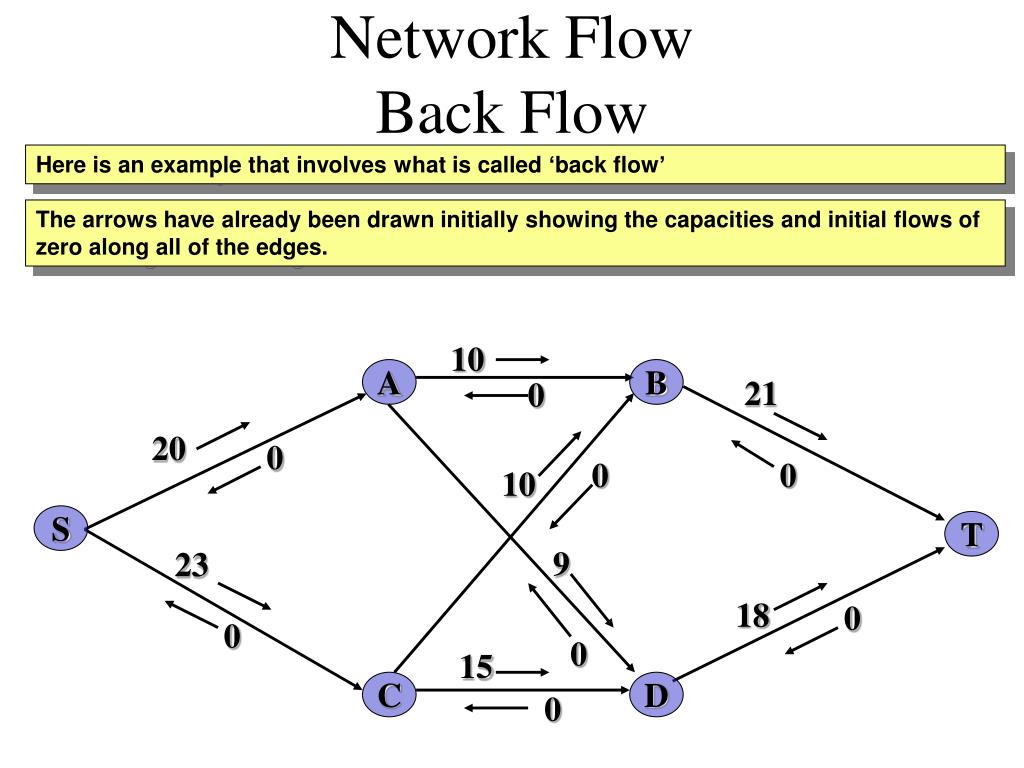
Network Flow Back Flow. Here is an example that involves what is called ‘back flow’. The arrows have already been drawn initially showing the capacities and initial flows of zero along all of the edges. 10. A. B. 21. 0. 20. 0. 0. 0. 10. S. T. 9. 23. 18. 0. 0. 0. 15. C. D.
Network Flow Back Flow - slide 1
01 / 8Network Flow Back Flow
1 / 17

Télécharger la présentation

Network Flow Back Flow
Une image / un lien ci-dessous est fourni (tel quel) pour télécharger la présentation

Politique de téléchargement : le contenu du site vous est fourni TEL QUEL pour votre information et votre usage personnel ; il ne peut être vendu, concédé sous licence ni partagé sur d’autres sites sans l’accord de son auteur.Le contenu vous est fourni TEL QUEL, pour votre information et votre usage personnel uniquement. Téléchargez la présentation en cliquant sur ce lien. Lors du téléchargement, si vous ne parvenez pas à télécharger une présentation, l’éditeur a peut-être supprimé le fichier de son serveur.Pendant le téléchargement, si vous ne parvenez pas à obtenir une présentation, le fichier a peut-être été supprimé par l’éditeur.

F I N

Plus de contenu associé

Transcription de la présentation
  1. Network Flow Back Flow Here is an example that involves what is called ‘back flow’ The arrows have already been drawn initially showing the capacities and initial flows of zero along all of the edges. 10 A B 21 0 20 0 0 0 10 S T 9 23 18 0 0 0 15 C D 0

  2. Network Flow Back Flow To start with let’s choose the flow augmenting path SABT. The minimum excess capacity along this path is 10, so we increase the flow by 10. Arrows in the direction of the path are decreased by 10 and arrows against the direction of the path are increased by 10. 0 10 11 A B 21 0 10 10 20 0 0 0 10 10 10 S T 9 23 18 0 0 0 15 C D 0

  3. Network Flow Back Flow Our next flow augmenting path is SCDT. The minimum excess capacity along this path is 15, so we increase the flow by 15. Arrows in the direction of the path are decreased by 15 and arrows against the direction of the path are increased by 15. 0 10 11 A B 21 0 10 10 20 0 0 0 10 10 10 S T 8 9 23 3 18 0 0 15 0 15 0 15 C D 0 15

  4. Network Flow Back Flow Consider now the flow augmenting path SCBT. The minimum excess capacity along this path is 8, so we increase the flow by 8. Arrows in the direction of the path are decreased by 8 and arrows against the direction of the path are increased by 8. 0 10 11 A B 21 0 10 3 10 20 0 2 0 0 10 10 10 8 18 S T 8 0 9 23 3 18 0 0 15 0 15 0 23 15 C D 0 15

  5. Network Flow Back Flow Another flow augmenting path is SADT. The minimum excess capacity along this path is 3, so we increase the flow by 3. Arrows in the direction of the path are decreased by 3 and arrows against the direction of the path are increased by 3. 0 10 11 A B 21 0 7 10 3 10 20 0 2 0 0 10 10 13 10 8 18 S T 8 0 9 6 23 0 3 18 0 0 3 15 0 15 0 23 15 18 C D 0 15

  6. Network Flow Back Flow Remember that a flow augmenting path is any path from S to T following non-zero arrows. The path SADCBT is such a path. What is different about this path is that when following the edge DC we are going against the direction of the edge – hence the term back flow. Are there any more flow augmenting paths? 0 10 11 A B 21 0 7 10 3 10 20 0 2 0 0 10 10 13 10 8 18 S T 8 0 9 6 23 0 3 18 0 0 3 15 0 15 0 23 15 18 C D 0 15

  7. Network Flow Back Flow What is actually happening is that flow along CD is being diverted along CB which means that DT is able to take more flow from AD as a result. The minimum excess capacity along SADCBT is 2 and so the flow changes by 2. All arrows in the direction of the path are reduced by 2, All arrows against the direction of the path are increased by 2. Are there any more flow augmenting paths? 0 10 11 A B 21 0 5 7 10 3 1 10 20 0 0 2 0 0 10 10 13 10 8 15 10 18 20 S T 8 0 9 6 23 4 0 3 18 0 5 2 0 3 15 0 15 0 23 15 18 C D 0 15 13

  8. Network Flow Back Flow We have a flow of 23 + 15 = 38 out of the source and 20 + 18 = 38 into the sink. This is the maximum flow. The flows are equal to all the arrows going against the direction of the edges. 0 10 20 10 11 A B 15 21 0 5 3 10 3 1 10 20 0 0 2 0 0 10 10 17 10 8 15 10 18 20 S T 8 0 10 9 6 23 4 0 3 18 0 5 2 5 0 3 15 0 15 0 23 15 23 18 C D 18 0 15 13 13