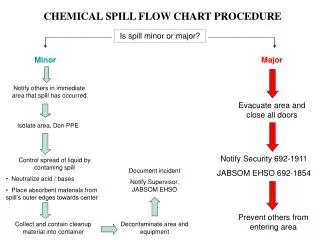
Network Flow Labelling Procedure
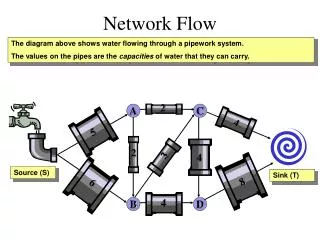
Network Flow Labelling Procedure. The diagram above shows water flowing through a pipework system. The values on the edges are the capacities of water that they can carry. We can find the maximum flow through these pipes using the labelling procedure. 2. A. C. 4. 5. 3. 2. S. 4. T.


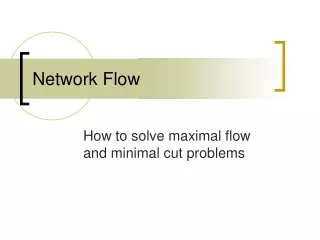
Network Flow Labelling Procedure
E N D
Presentation Transcript
Network Flow Labelling Procedure The diagram above shows water flowing through a pipework system. The values on the edges are the capacities of water that they can carry. We can find the maximum flow through these pipes using the labelling procedure. 2 A C 4 5 3 2 S 4 T 8 6 B D 4
Network Flow Labelling Procedure Each edge will be labelled with two arrows. The forward arrow will indicate the amount of excess capacity – the potential increase. The backward arrow will indicate the current flow - the potential decrease. Initially the excess capacities are the full capacity and the flows are all zero. At each stage we try to find a path from S to T that consists of non-zero arrows. Initially there are there are many such flow augmenting paths. One example is SACT. The minimum arrow along this path is 2, and so this is our increase in the flow. 2 A C 0 5 4 0 0 3 4 2 0 S T 0 6 0 8 0 0 4 B D 0
Network Flow Labelling Procedure We decrease all the arrows in the direction of this path by 2, and increase all the arrows against the direction of this path by 2. 0 2 A C 0 2 3 5 4 0 2 2 0 3 4 2 2 0 S T 0 6 0 8 0 0 4 B D 0
Network Flow Labelling Procedure Now we choose another flow augmenting path. One example is SABCT. The minimum arrow along this path is 2, and so this is our increase in the flow. We decrease all the arrows in the direction of this path by 2, and increase all the arrows against the direction of this path by 2. 0 2 A C 0 2 1 3 5 4 0 2 0 2 0 1 3 4 4 2 2 4 0 S 0 2 T 0 2 6 0 8 0 0 4 B D 0
Network Flow Labelling Procedure For our next flow augmenting path let’s choose SBDT. The minimum arrow along this path is 4, and so this is our increase in the flow. We decrease all the arrows in the direction of this path by 4, and increase all the arrows against the direction of this path by 4. 0 2 A C 0 2 1 3 5 4 0 2 0 2 0 1 3 4 4 2 2 4 0 S 0 2 T 2 0 2 6 0 4 8 0 0 4 0 4 4 B D 0 4
Network Flow Labelling Procedure Are there any more flow augmenting paths? Remember we are looking for paths following non-zero arrows from S to T. Yes, there is the path SBCDT, with minimum arrow 1, so we can increase the flow by 1. We decrease all the arrows in the direction of this path by 1, and increase all the arrows against the direction of this path by 1. 0 2 A C 0 2 1 3 5 4 0 2 0 2 0 0 1 3 3 4 4 2 2 4 0 S 0 2 T 1 2 0 2 6 0 1 3 3 4 8 0 0 4 0 5 4 4 5 B D 0 4
Network Flow Labelling Procedure We now have a flow of 9 out of the source (backwards arrows) and into the sink. This is the maximum flow (you will be able to prove this at a later stage). We can write on the final flows on the diagram. We read them off the backward arrows on each edge. 0 2 2 4 A C 4 0 2 1 3 5 4 0 2 0 2 0 0 1 3 3 4 4 2 2 3 4 0 1 S 0 2 T 1 2 0 2 6 0 1 3 2 3 4 8 0 0 4 5 0 5 4 4 4 5 5 B D 0 4