Download
1 / 1
10 likes | 226 Vues
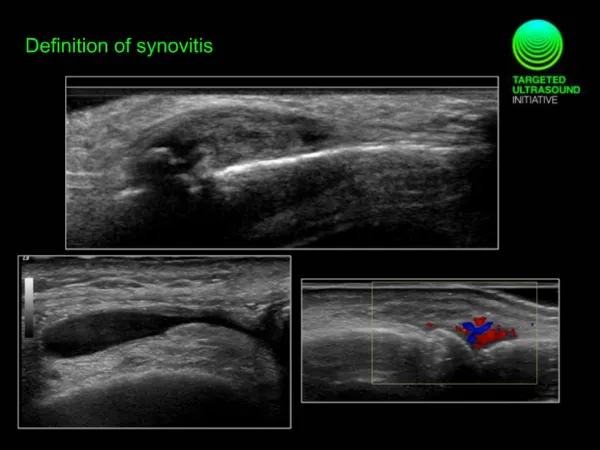
Late synovial enhancement detects effects of intra-articular steroids on synovitis better than synovial volume A. D. Gait 1 , E . J. Marjanovic 1,2 , M. J. Parkes 2 ,R. Hodgson 1 , T. F. Cootes 1 , T . W. O'Neill 2 ,5 , C . E. Hutchinson 3 , D. T. Felson 2 ,4,5

E N D
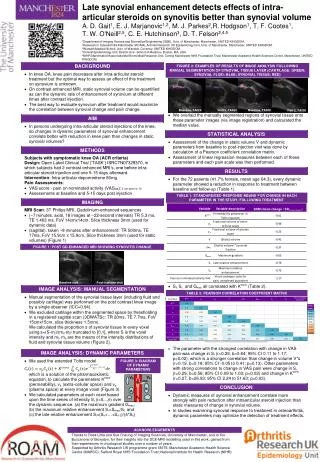
Late synovial enhancement detects effects of intra-articular steroids on synovitis better than synovial volume A. D. Gait1, E. J. Marjanovic1,2, M. J. Parkes2,R. Hodgson1, T. F. Cootes1, T. W. O'Neill2,5, C. E. Hutchinson3, D. T. Felson2,4,5 1Department of Imaging Science and Biomedical Engineering (ISBE), Univ. of Manchester, Manchester, UNITED KINGDOM. 2Research in Osteoarthritis Manchester (ROAM), Arthritis Research UK Epidemiology Unit, Univ. of Manchester, Manchester, UNITED KINGDOM. 3Warwick Medical School, Univ. of Warwick, Coventry, UNITED KINGDOM. 4Clinical Epidemiology Unit, Boston Univ. School of Medicine, Boston, MA, USA. 5NIHR Manchester Musculoskeletal Biomedical Research Unit, Central Manchester NHS Foundation Trust, Manchester Academic Health Sciences Centre, Manchester, UNITED KINGDOM. ve FIGURE 1: POST GD-ENHANCED MRI SHOWING SYNOVITIS CHANGE Ktrans Baseline visit Post-injection visit vi vi Baseline, TA024 Baseline, TA009 Visit 2, TA024 Visit 2, TA009 ve vp TABLE 1: STANDARDISED RESPONSE MEANS FOR CHANGE IN EACH PARAMETER IN THE STUDY, FOLLOWING TREATMENT TABLE 2: PEARSON CORRELATION COEFFICIENT MATRIX FIGURE 2: EXAMPLES OF RESULTS OF IMAGE ANALYSIS FOLLOWING MANUAL SEGMENTATION OF SYNOVIAL TISSUE LAYER (CARTILAGE: GREEN; SYNOVIAL FLUID: BLUE; SYNOVIAL TISSUE: RED) FIGURE 3: DIAGRAM OF DYNAMIC PARAMETERS ACKNOWLEDGEMENTS Thanks to Ross Little and Sue Cheung of Imaging Sciences, University of Manchester, and to GioBuccanorsi of Bioxydyn, for their insights into the DCE-MRI modelling used in this work, gained from their experiences in oncological studiesover a number of years. Supported by Arthritis Research UK programme grant 18676; Manchester Academic Health Science Centre (MAHSC); Salford Royal NHS Foundation Trust; National Institute for Health Research (NIHR)