Download
1 / 89
890 likes | 1.07k Vues
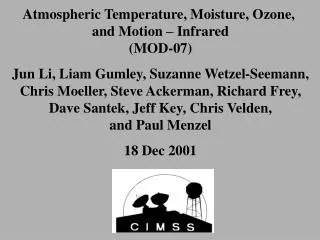
Atmospheric Temperature, Moisture, Ozone, and Motion – Infrared (MOD-07) Jun Li, Liam Gumley, Suzanne Wetzel-Seemann, Chris Moeller, Steve Ackerman, Richard Frey, Dave Santek, Jeff Key, Chris Velden, and Paul Menzel 18 Dec 2001. VIIRS. MODIS.

E N D
Atmospheric Temperature, Moisture, Ozone, and Motion – Infrared (MOD-07) Jun Li, Liam Gumley, Suzanne Wetzel-Seemann, Chris Moeller, Steve Ackerman, Richard Frey, Dave Santek, Jeff Key, Chris Velden, and Paul Menzel 18 Dec 2001
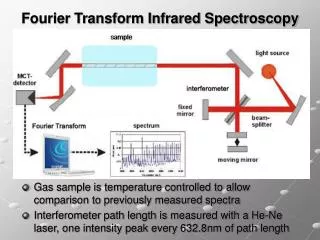
VIIRS MODIS Earth emitted spectra overlaid on Planck function envelopes CO2 H20 O3 CO2
Atmospheric Profile Retrieval from MODIS Radiances ps I = sfc B(T(ps)) (ps) - B(T(p)) [ d(p) / dp ] dp . o I1, I2, I3, .... , In are measured with MODIS P(sfc) and T(sfc) come from ground based conventional observations (p) are calculated with physics models Regression relationship is inferred from (1) global set of in situ radiosonde reports, (2) calculation of expected radiances, and (3) statistical regression of observed raob profiles and calculated MODIS radiances Need RT model, estimate of sfc, and MODIS radiances
MODIS bands 30-36 MODIS bands 20-29
MAS 11um MODIS on Terra MODIS FOV Windows MAS, SHIS on ER-2 705 km CO2 CO2 H2O 20 km q MODIS Emissive Band Cal/Val from ER-2 Platform • Transfer S-HIS cal to MAS • Co-locate MODIS FOV on MAS • Remove spectral, geometric dependence • WISC-T2000, SAFARI-2000, TX-2001
Influence of Altitude Difference between MODIS and MAS CO2 Atmospheric absorption above the ER-2 altitude (20 km) is important for O3 and CO2 sensitive bands. O3
2000 Jan Feb Mar Apr May Jun Jul Aug Sep Oct Nov Dec 2001 Jan Feb Mar Apr May Jun Jul Aug Sep Oct Nov Dec Switch to Side B MODIS first light Side A S/MWIR bias adjustment to 79/110 WISC-T2000 SAFARI-2000 Side A S/MWIR bias at 79/190 TX-2001
Calibration MODIS - SHIS > 0 MODIS too warm < 0 MODIS too cold Residual SpecNoise
Band 34 Noisy Detectors
Baja 11um 14.3um Pre launch correction A known optical leak at 11um caused the image of the Baja peninsula to be present in MODIS 14.3um data. Through testing, the pre-launch correction coefficients were revised, removing the contamination. Correcting Crosstalk 14.3um Post launch correction
GOES 3 by 3 FOVs (30 km) 11 micron MODIS 5 by 5 FOVs (5 km)
Atmospheric Profile Retrieval from MODIS Radiances ps I = sfc B(T(ps)) (ps) - B(T(p)) [ d(p) / dp ] dp . o I1, I2, I3, .... , In are measured with MODIS P(sfc) and T(sfc) come from ground based conventional observations (p) are calculated with physics models Regression relationship is inferred from (1) global set of in situ radiosonde reports, (2) calculation of expected radiances, and (3) statistical regression of observed raob profiles and calculated MODIS radiances Need RT model, estimate of sfc, and MODIS radiances
The MODIS AP algorithms are based on a regression procedure, and makes use of the NOAA-88 data set containing more than 7500 global profiles of temperature and moisture to determine the regression coefficients. The radiative transfer calculation of the MODIS spectral band radiances is performed for each training profile using the Pressure layer Fast Algorithm for Atmospheric Transmittances (PFAAST) transmittance model. This model has 101 pressure layer vertical coordinates from 0.1 to 1050 hPa and takes into account the satellite zenith angle, absorption by well-mixed gases (including nitrogen, oxygen, and carbon dioxide), water vapor, and ozone. The MODIS instrument noise is added into the calculated spectral band radiances, and these radiative transfer calculations provide a temperature-moisture-ozone profile and MODIS radiance pair for use in the statistical regression analysis.
5km resolution MODIS 500hPa T 30km resolution GOES
MODIS AMSU 850 mb 24 Aug 00 MODIS
500 mb 24 Aug 00 MODIS AMSU
MODIS AMSU 50 mb 24 Aug 00
4mm Surface Reflection must be considered December 10, 2001 MODIS Meeting
Mitigating Problems in MODIS AP Algorithm *Changed predictors band 24 and 25 (4.4 and 4.5 um) brightness temperatures to their BT difference to remove surface effects: Old algorithm had 12 predictors: individual bands 24, 25, and 27 through 36. New algorithm has 11 predictors: band 25 - 24 BT difference and individual bands 27 through 36. * Implemented preliminary radiance bias corrections. Currently based only on CART site data, global biases are in progress. * Applied post-launch NEdT in place of pre-launch. December 18, 2001 MODIS Science Team Meeting
850 500 300 New Operational
MODIS 5 km resolution Ozone Ozone GOES 30 km resolution
MODIS ozone is very close to the GOES ozone (over North America); rms of about 10 Dobsons; polar extreme ozone values will be improved
TOMS Ozone MODIS Ozone
Algorithm Change effect on Total Column Ozone (dob) Operational “New”
A Preview of ABI High Resolution Water Vapor Imagery1 km MODIS & 4x8 km GOES
Every 100 min MODIS covers polar regions x
x
Winds from MODIS: An Arctic Example Cloud-track winds (left) and water vapor winds (right) from MODIS for a case in the western Arctic. The wind vectors were derived from a sequence of three images, each separated by 100 minutes. They are plotted on the first 11 mm (left) and 6.7 mm (right) images in the sequence.
Orbital Issues How often can wind vectors be obtained from a polar-orbiting satellites? The figure below shows the time of successive overpasses at a given latitude-longitude point on a single day with only the Terra satellite. The figure at the upper right shows the frequency of "looks" by two satellites: Terra and (the future) Aqua. The figure at the lower right shows the temporal sampling with five satellites.
Early Estimates of UW MODIS Atmospheric Products Quality MODIS IR radiances agree to within 1.5 C with GOES and ER-2 MAS/SHIS MODIS layer tropospheric temperatures compare well with AMSU; rms better than 1 C, both within 2 C of radiosonde observations; validated with know characteristics CART site validation ongoing. MODIS layer dewpoint temperatures depict gradients very well; are within 3-4 C of radiosonde observations. MODIS ozone is very close to the GOES ozone (over North America); rms of about 10 Dobsons; polar extreme ozone values will be improved with more training data. validated with known characteristics. MODIS polar winds represent coherent atmospheric motion; model assimilation underway; geo-like quality observed; within 7 – 10 m/s of the few raobs available for validation.
Total Precipitable Water Vapor – Infrared(MOD-05) Suzanne Wetzel-Seemann, Jun Li, Liam Gumley, and Paul Menzel 18 Dec 2001
VIIRS, MODIS, FY-1C, AVHRR CO2 O2 O3 H2O O2 H2O H2O H2O O2 H2O H2O CO2
VIIRS MODIS Earth emitted spectra overlaid on Planck function envelopes CO2 H20 O3 CO2
Total Water Vapor Retrieval from MODIS IR Radiances ps I = sfc B(T(ps)) (ps) - B(T(p)) [ d(p) / dp ] dp . o I1, I2, I3, .... , In are measured with MODIS P(sfc) and T(sfc) come from ground based conventional observations (p) are calculated with physics models Regression relationship is inferred from (1) global set of in situ radiosonde reports, (2) calculation of expected radiances, and (3) statistical non-linear regression of observed Raob TPW and calculated MODIS radiances (brightness temperatures) Need RT model, estimate of sfc, and MODIS radiances
The MODIS TPW algorithm is based on a regression procedure, and makes use of the NOAA-88 data set containing more than 7500 global profiles of temperature and moisture to determine the regression coefficients. The radiative transfer calculation of the MODIS spectral band radiances is performed for each training profile using the Pressure layer Fast Algorithm for Atmospheric Transmittances (PFAAST) transmittance model. This model has 101 pressure layer vertical coordinates from 0.1 to 1050 hPa and takes into account the satellite zenith angle, absorption by well-mixed gases (including nitrogen, oxygen, and carbon dioxide), water vapor, and ozone. The MODIS instrument noise is added into the calculated spectral band radiances, and these radiative transfer calculations provide a temperature-moisture-ozone profile and MODIS radiance pair for use in the statistical regression analysis.
GOES vs. MODIS 2000/06/30 1600 UTC Total Precipitable Water (mm)
MODIS total precipitable water vapor shows a wet bias wrt GOES; bias 1.5 mm and rms of 3 mm; bias will be removed after more validation
MODIS TPW June 2, 2001: Operational Algorithm SWIR daytime reflection causing wet atm over African desert December 10, 2001 MODIS Meeting
Mitigating Problems in MODIS TPW Algorithm *Changed predictors band 24 and 25 (4.4 and 4.5 um) brightness temperatures to their BT difference to remove surface effects: Old algorithm had 12 predictors: individual bands 24, 25, and 27 through 36. New algorithm has 11 predictors: band 25 - 24 BT difference and individual bands 27 through 36. * Separated training into five regression BT zones to include a broader range of moisture regimes * Implemented preliminary radiance bias corrections. Currently based only on CART site data, global biases are in progress. * Applied post-launch NEdT in place of pre-launch. December 18, 2001 MODIS Science Team Meeting
MODIS TPW June 2, 2001: Operational Algorithm (IR ch 24 –> 36)
MODIS TPW June 2, 2001: New Algorithm 1 (Ch 24 -25)
MODIS TPW June 2, 2001: New Algorithm 2 (5 zones)
MODIS TPW June 2, 2001: New Algorithm 3 (5 overlapping zones)
1 2 3
New MODIS TPW Algorithm: Comparison with NOAA-15 Advanced Microwave Sounding Unit (AMSU) for June 2, 2001 TPW (cm) MODIS new TPW (cm) June 2, 2001 AMSU TPW (cm) June 2, 2001