Download
1 / 14
140 likes | 354 Vues
TUCAN T omography U nder C osta Rica A nd N icaragua NSF-Margins. David L. Abt Karen M. Fischer, Laura Martin Brown University. AGU 2005 Fall Meeting Session: T31D 12/7/05 0900. Shear-wave Splitting Tomography in the Central American Mantle Wedge. Geoffrey A. Abers

E N D
TUCAN Tomography Under Costa Rica And Nicaragua NSF-Margins David L. Abt Karen M. Fischer, Laura Martin Brown University AGU 2005 Fall Meeting Session: T31D 12/7/05 0900 Shear-wave Splitting Tomography in the Central American Mantle Wedge Geoffrey A. Abers Boston University J. Marino Protti, Victor Gonzalez OVSICORI Wilfried Strauch, Pedro Perez, Allan Morales INETER
Shear-wave Splitting Tomography • TUCAN Seismic Array • 48 IRIS/PASSCAL Broadband Seismic Stations • 20 Month Deployment (August 2004 - March 2006) • Close Station Spacing (10 - 50 km) • Excellent Data Recovery Rate (>95%)
STUDY AREA Shear-wave Splitting Tomography • Why Central America? • Large along arc geochemical variations • Different melting environments? • Compare geochemical models with seismic imaging results (e.g., VP, VS, VP/VS, Q, Anisotropy) NOAA National Geophysical Data Center e.g., Carr (1984); Carr et al. (2003); DeMets (2001); Roggensack (2001); Walker et al. (2001)
Shear-wave Splitting Tomography SHEAR-WAVE SPLITTING TOMOGRAPHY • Objective: • Method: • Preliminary Results & Implications… • Help constrain flow, melt and volatile distribution by modeling anisotropic structure in the wedge • Shear-wave splitting analysis • Forward model: synthetic waveforms • Linearized inversion
Jung and Karato (2001) Bystricky et al. (2000) ~350 MPa J&K (2001) Typical Mehl et al. (2003) 1200-1300oC Shear-wave Splitting Tomography Causes of Anisotropy After Jung and Karato (2001) • Alignment of anisotropic minerals (LPO)e.g., Olivine and OPX • * Effects of H2O, Pressure, Stress * • Alignment of melt bands or fractures (SPO) Actual Apparent Fast Axis Not Necessarily Parallel to Shear Direction Holtzman et al. (2003)
High Quality Splits Waveforms Analyzed Phase Local S 817 127 SKS ~200 64 Trench Shear-wave Splitting Tomography Data Set (so far…): Laura Martin Pacific Ocean Caribbean Sea • Local S waves • Magnitude > 2.6 • In shear-wave window • SKS waves • Magnitude > 5.8 Local S Ray Path Arc Volcano Seismic Station
Shear-wave Splitting Measurements • Local S splits plotted at ray path midpoints • SKS splits plotted at stations Shear-wave Splitting Tomography Caribbean Sea Pacific Ocean
Fischer et al. (2000) Shear-wave Splitting Tomography • Inversion Method • Block parameterized model • FORWARD MODELING -Synthetic waveform propagation through multiple anisotropic blocks • Weighted, damped, least-squares inversion Perturb a-axis or anisotropic strength in each block Apply starting crystallographic orientation and strength of anisotropy to each model block Use forward modeling to calculate partial derivatives for each inversion iteration
Shear-wave Splitting Tomography Preliminary Results Tested:Block size, starting model, damping, and block covariance • Preferred Model: • 25-30 km thick blocks • 0.5 x 0.5 degree blocks • Minor damping • No covariance • Starting Parameters:F = -30 • Strength of Anisotropy = 24% • 25 Iterations
Arc-Parallel Arc-Normal Arc-Parallel Arc-Normal Shear-wave Splitting Tomography Preliminary Results Horizontal slices through preferred model
Shear-wave Splitting Tomography Preliminary Results Depth (km) View looking SW
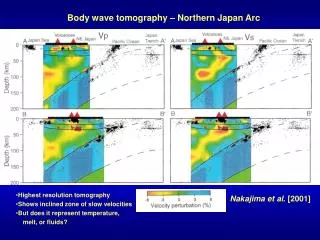
Shear-wave Splitting Tomography Summary of Results Local S Inversion SKS Measurements Arc-parallel fast directions dominate, except for two arc-normal columns Additional anisotropy with arc-parallel fast direction beneath region sampled by local S waves and farther into the back-arc (1 - 1.5 s of splitting)
~5 months 127 Local Splits ~20 months ~500 Splits? Shear-wave Splitting Tomography Interpretation Further Work • Regional arc-parallel flow • Oblique convergence or far-field effects? • Localized arc-normal zones affected by melt and possibly volatiles? • Full data set • 3-D rotations of fast direction • Optimize model uniqueness and resolution e.g., Clint Conrad (personal communication); Behn et al. (2004)
Shear-wave Splitting Tomography Questions ?