Download
1 / 2
20 likes | 163 Vues
supplementary Figure 1 . Association score. A. B. M. musculus S. cerevisiae M. mulatta M. tuberculosis C. elegans R. norvegicus E. coli D. rerio P. aeruginosa. supplementary Figure 2 . Soft 1 st set. Soft 2 nd set. Soft 3 rd set. Decreased in S3. Decreased in S3.

E N D
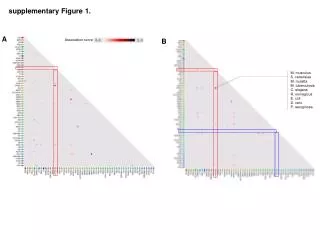
supplementary Figure 1. Association score A B M. musculus S. cerevisiae M. mulatta M. tuberculosis C. elegans R. norvegicus E. coli D. rerio P. aeruginosa
supplementary Figure 2. Soft 1st set Soft 2nd set Soft 3rd set Decreased in S3 Decreased in S3 Decreased in S3 Log normalized intensity S1 Log normalized intensity S1 Log normalized intensity S1 Increased in S3 Increased in S3 Increased in S3 Log normalized intensity S3 Log normalized intensity S3 Log normalized intensity S3 Bone 2nd set Bone 3rd set Bone 1st set Decreased in B8 Decreased in B8 Decreased in B8 Log normalized intensity B2 Log normalized intensity B2 Log normalized intensity B2 Increased in B8 Increased in B8 Increased in B8 Log normalized intensity B8 Log normalized intensity B8 Log normalized intensity B8


