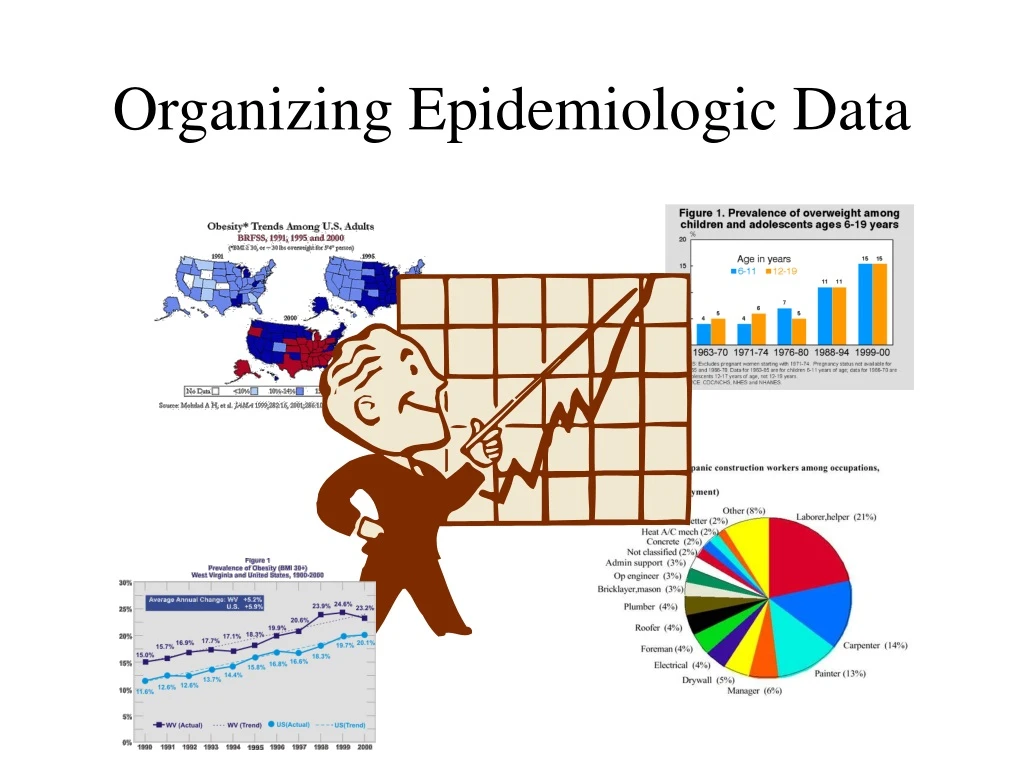

Organizing Epidemiologic Data
E N D
Presentation Transcript
Importance of Data Organization • Makes large data sets manageable • Allows for analysis • Relationships between disease and exposure • Trends • Communication
Tables • Arranged in rows and columns • Can show patterns, trends, relationships or differences • Simplicity • Self-explanatory
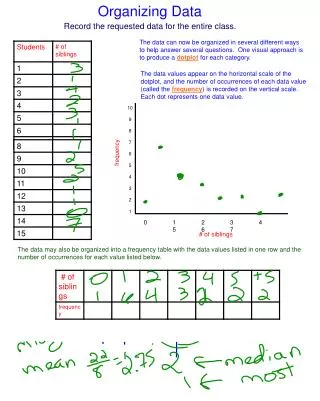
One-Variable Table • Frequency Distribution • 1st Column shows category • Sex = Male or Female • 2nd Column shows Number in each category • Can have additional columns • Percent • Cumulative percent
Two- and Three-Variable Tables • More in depth analysis • Be careful not to get to complicated • Look for associations • 3rd variable allows for stratification
Ill Well Total Exposed Unexposed Total N Use of Two-By-Two Tables • Calculate association between disease and exposure a b c d ad/bc = Odd Ratio Relative Risk
Odd Ratio = 100 x 2340/89 x 811 = 234000/72179 OR = 3.24 Exercise 4.1B on page 212
OR = 12 x 17/2 x 5 = 204/10 OR = 20.4 Answer to 4.1B
Class intervals • May want to group data • Split variables into Categories • Age • Continuous (1, 2, 3, etc….) • Categorical (<1, 1-5, 6-10, etc….) • Watch out for overlap
Graphs/Charts • Shows data visually • Patterns, trends similarities and differences • Audience remembers • Many types • Line • Histogram • Bar • Pie
Mapping • Use of Coordinates • Shows geographic location/distribution • Can be important in • Outbreak investigation • Health assessments • Intervention planning/evaluation
Mapping in Rabies Control • Background on raccoon strain rabies in WV • Oral Rabies Vaccine Project (ORV) • Active Surveillance • Rabies Coordinates • Establishing the ORV barrier
Benefits of Organizing Data • Summarizes large data sets • Displays Analysis • Visual representation of trends • Education • Funds • Increase knowledge