SlideServe
Menu
Préférences
© SlideServe · v2026

Understanding Retinal Ganglion Cell Responses to Light Stimulus through Autocorrelation Analysis

alvin-mccoy avatar
4 diapositives · 151 Views · Nov 20, 2014

Explore how autocorrelation is calculated and its implications for detecting repetition in responses of retinal ganglion cells to fluctuating light stimuli. Learn about cross-correlation functions using Matlab, Fourier transform applications, and time calculations.
Understanding Retinal Ganglion Cell Responses to Light Stimulus through Autocorrelation Analysis - slide 1
01 / 4Understanding Retinal Ganglion Cell Responses to Light Stimulus through Autocorrelation Analysis
1 / 17

Télécharger la présentation

Understanding Retinal Ganglion Cell Responses to Light Stimulus through Autocorrelation Analysis
Une image / un lien ci-dessous est fourni (tel quel) pour télécharger la présentation

Politique de téléchargement : le contenu du site vous est fourni TEL QUEL pour votre information et votre usage personnel ; il ne peut être vendu, concédé sous licence ni partagé sur d’autres sites sans l’accord de son auteur.Le contenu vous est fourni TEL QUEL, pour votre information et votre usage personnel uniquement. Téléchargez la présentation en cliquant sur ce lien. Lors du téléchargement, si vous ne parvenez pas à télécharger une présentation, l’éditeur a peut-être supprimé le fichier de son serveur.Pendant le téléchargement, si vous ne parvenez pas à obtenir une présentation, le fichier a peut-être été supprimé par l’éditeur.

F I N

Plus de contenu associé

Transcription de la présentation
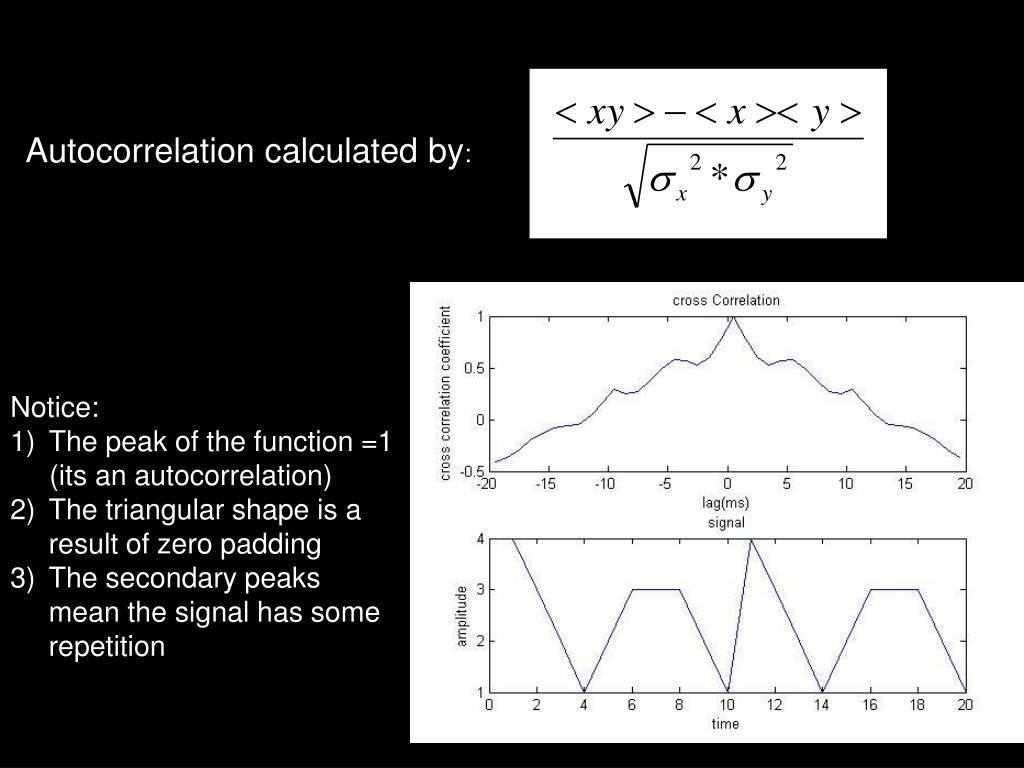
  1. Autocorrelation calculated by: • Notice: • The peak of the function =1 • (its an autocorrelation) • The triangular shape is a result of zero padding • The secondary peaks mean the signal has some repetition

  2. retinal ganglion cell responses to a fluctuating light stimulus

  3. The peaks of the cross correlation functions using Matlab’s “xcorr” Offt, On Offs, On cross correlation coefficient Offs, Offt Offt, Offs Time (ms)

  4. Using the Fourier transform to calculate the cross correlation A = fft (signal a) B = fft (signal b) Fourier Cross Correlation = ifft(A*conj(B))