Download
1 / 1
10 likes | 155 Vues
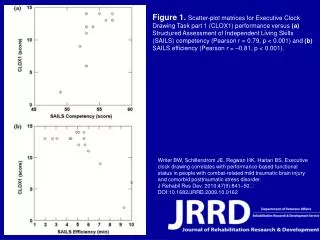
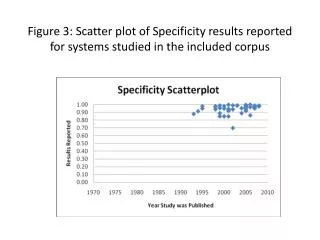
Figure 3: Scatter plot of Specificity results reported for systems studied in the included corpus.

E N D
Figure 3: Scatter plot of Specificity results reported for systems studied in the included corpus