Download
1 / 10
110 likes | 710 Vues
Break Even Analysis Strengths and weaknesses. AS Business Studies. Aims and Objectives. Aim: Understand the strengths and weaknesses of break even analysis. Objectives: Discuss the strengths and weaknesses of break even analysis. Analyse break even exam questions. Strength or Weakness.

E N D
Break Even Analysis Strengths and weaknesses AS Business Studies
Aims and Objectives Aim: • Understand the strengths and weaknesses of break even analysis. Objectives: • Discuss the strengths and weaknesses of break even analysis. • Analyse break even exam questions
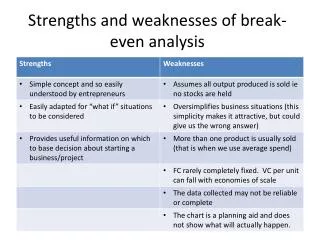
Strength or Weakness • Simple concept formula can be understood by most entrepreneurs. • Misleading data or inaccurate information leads to incorrect break even analysis. • Does not show what will definitely happen, its just a prediction and a planning aid. • Can be used to support finance applications. • Fixed costs are rarely completely fixed. • Variable costs differ as more large quantities are produced, not steady.
Strength or Weakness • Many firms sell more than one product, therefore it is harder to apply to these businesses. • Can be quickly adapted to suit different potential things happening to the business • Can be used for planning ahead and decision making.
Exam Style Question ‘Tom forecast that the average customer would spend £15.60 per visit. He believed that he would have variable costs per customer visit of £5.10 in 2011. He was expecting to reduce his variable costs by 10% in 2012. Based on information from the franchisor and a survey of a small random sample of local people, Tom estimated that he would get 7700 customers in the first year….high payments for the rights to be a franchisee meant that fixed costs would be £63 000 per annum
2011 Break Even First • Definition: Fixed Costs / Contribution Per Unit • We know fixed cost but not CPU. • Contribution per unit = SPpu-Vcpu • £15.60 - £5.10 = £10.50 • £63,000 / £10.50 = 6000 customers/units
2012 Break Even Second • Variable costs per customer fallen 10% • Variable cost = £5.10 / 100 = £0.051 x 10 = £0.51 • £5.10 - £0.51 = £4.59 • £4.59 new variable cost per customer
2012 Break Even Second • New contribution = Selling Price – New VC figure • £15.60 - £4.59 = £11.01= CPU • Break Even = Fixed Costs / CPU • 63,000 / £11.01 = 5722 or 5723 customers to break even
Calculate Change in Break Even • 2011 Break Even – 2012 Break Even • 6000 – 5723 = 277 or 278 fewer customers needed