Download
1 / 31
310 likes | 317 Vues
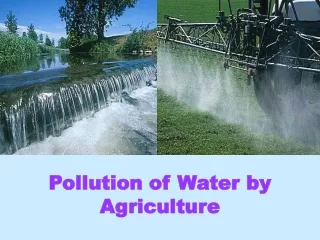
Water Pollution from Agriculture. John Braden University of Illinois, USA Visiting, Katholieke Universiteit Leuven Lecture 3 Leuven, Belgium March 2004. Outline. 1. Overview 2. Agriculture and Water Values Production input Landscape attribute Environmental Impacts Pesticides N & P

E N D
Water Pollution from Agriculture John Braden University of Illinois, USA Visiting, Katholieke Universiteit Leuven Lecture 3 Leuven, Belgium March 2004
Outline 1. Overview 2. Agriculture and Water Values • Production input • Landscape attribute • Environmental Impacts • Pesticides • N & P • Flooding 3. Policy Issues
Helpful Resources • National Research Council. 1997. Valuing Ground Water. National Academy Press. • Bergstrom, et. al. 2001. TheEconomic Value of Water Quality. Edward Elgar.
Agriculture and Water a) Water as input • Natural • Irrigation b) Landscape agriculture c) Environmental byproducts • Pesticides – human health and pest resistance • N and P loads to water – health, aesthetics, ecology • Drainage – flooding, erosion, ecology
Surface vs. Groundwater • In-situ value • Amenities, recreation, navigation • Storage value • Pressure • Future use • Time lags • Extractive values • Pumping costs • Treatment costs
a) Water as an Input • Valuation methods • Production function analysis • Crop budget analysis • Value varies with: • Application efficiency (technology) • Amount applied • Crop response to water • Value of crop
Water As an Input Value derived from crop production Crop/ha Production function Water/ha
Water As an Input Value derived from crop production Crop/ha Production function TVMPw = ∫w Pc·MPw Marginal Product Water/ha
Sample Input Values (1980, Gibbons) • Citrus $0.08 - 0.88 /m3 • Potatoes $0.23 – 0.57 /m3 • Cotton $0.05 – 0.10 /m3 • Corn $0.04 - 0.06 /m3 • Wheat/Alfalfa $0.01 - 0.05 /m3
b) Landscape Agriculture • Water bundled into rural panorama • Growing justification for EU agricultural/rural subsidies
Value of Water Amenities • Complements • Property values • Travel costs • Stated Preferences • Existence & bequest motives • Passive interests
c) Environmental Byproducts: 1. Pesticides • Benefits: increased crop yields • External costs • Pest resistance • Health effects of ingestion/inhalation • Risk-based screening and cancellation • Health/ecological risks • Value of life? – 10-6 mortality threshold • Availability of substitutes reduces costs
Risk Reduction Benefits of Pesticides in Water • Averting Costs (substitutes) (Nielsen & Lee 1987) • $333/hh/yr - $67/hh/yr in cost to remove pesticide residues in potable water (cost differential reflect economies of scale) • Contingent valuation (Caudill, 1992) • Michigan residents willing to pay $43 - $46 /hh/yr (rural) $34 -$49 /hh/yr to protect groundwater from pesticide & nitrate contamination
Risk Reduction Benefits of Pesticides in Water (cont) • Dose-Response (production function) • Regulatory approvals • Frequency of additional cancer deaths • Damages not monetized • Consideration given to cost of substitutes
Environmental Byproducts2) N & P • N & P together in most fertilizers, manure • Aerosols • Municipal wastewater
N & P Balances in Belgium Flemish Environment Agency (VMM), MIRA-T 2003.
Environmental Impacts – N & P • Nitrogen (N) • N cycle is complex • Moves with water • Seasonal • Limiting in salt water systems (estuaries) - hypoxia • Methemoglobinemia in babies, pregnant women • Phosphorus (P) • limiting nutrient in freshwater • Limiting nutrient in agronomic manure use
N Damages • Contingent valuation • 25% reduction of N-contamination risk of the only aquifer on Cape Cod, Mass. $815/hh/yr ~ $1.50/m3/yr consumption (Edwards 1988) • Protect “safe” groundwater from future agricultural chemical contamination in Georgia (option value). $641 /hh/yr ~ $1.25/ m3/yr consump. (Sun et al. 1992) • Wisconsin private well owners WTP for groundwater protection program ensuring N< 10mg/L. $306 - $516 /hh/yr ($0.6 – $1.0 /m3/yrconsumption), depending on level of assurance.
N Damages (cont.) • Cost of substitutes: Health treatment (?) • Cost of substitutes: Averting expenditures • All water meets standard, 23% requires treatment: Marg. average operating costs $12.60 /m3 (John et al. 1998. Decatur, IL) • Bottled water for vulnerable populations: If bottled water is $10 /m3 & 2% of water is replaced ~ $0.20 /m3 for total supply. BUT, more risk.
Economic Costs of Reducing N from Manure: Swine in the Netherlands* Policy goal: > 90% reduction * Polman and Theijssen, 2002. Agricultural Economics
Welfare Costs of Averting Nitrogen from Mississippi R.: Agricultural Fertilizer Reduction [103 m.t.] (10%) (Ribaudo, M. et al., 2001. Ecological Economics.)
Environmental Byproducts3) Drainage & Flooding • Agriculture speeds drainage • Benefits crops • Downstream areas subject to more intense, more frequent floods • Amplified by channelization, flood protection
Flood Valuation • Complements: • Property values: 3 – 5% • Ephemeral -- consumers are myopic • Substitutes: • Insurance premiums: 5 – 6 % of property value • Expenditures on flood protection (subsidies) • Costs of on-site storm water management
Agr & Water: Policy Issues • Private vs. public rights • Monitoring and transactions costs – Targeting • Regulation vs. incentives • Management practices • Taxes/subsidies • Transferable allowances (marketable permits)
Supplying Water Quality Cost (€) Farm A Farm B Total Abatement
Technical Regulation Cost (€) Farm A Farm B Total CA CB Abatement Required Abatement Total Abatement
Incentive-based policies Cost (€) Farm A Farm B Total CA t*=s*=Copt CB Abatement AA AB Req. Abatement Total Abatement
Regulation vs. Incentives • Incentives lower costs • Savings increase with goals & heterogeniety • Subsidies • Greater profitability & size of industry • Uncertain effect • Fees or taxes • Reduce profitability & size • Uncertain effect
Transferable Allowances • Permits – predictable outcomes • Hot-spots? • Trading allows incentives to work • Profit effects depend on allocation • Auction • Free allocation – windfall to recipients
Conclusions • Agriculture has significant quality & quantity affects on water • Monitoring, enforcement issues • Technical/regulatory approaches vs. incentives