Download
1 / 51
510 likes | 665 Vues
How Can I Improve My Soils? Nutrient Deficiencies and Fertilization. Rob Harrison, PNW Stand Management Cooperative http://www.forestsoils.org/.

E N D
How Can I Improve My Soils? Nutrient Deficiencies and Fertilization Rob Harrison, PNW Stand Management Cooperative http://www.forestsoils.org/
Covered today1) Tree nutrition2) Nutrient limitiations 3) Risk-rating soils for biomass/nutrient removal4) Fertilization to maintain/enhance fertility5) Identifying nutrient deficiency 6) BMP for maintaining or enhancing soil fertility
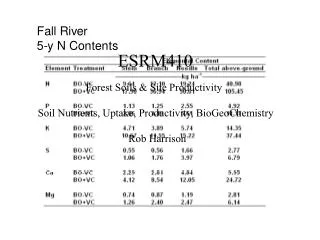
Table 1 US Timber trends. Data from: Howard, James L. 2003. U.S. timber production, trade, consumption, and price statistics 1965 to 2002. Res. Pap. FPL-RP-615. Madison, WI: U.S. Department of Agriculture, Forest Service, Forest Products Laboratory. 90 p.
outline Tree Nutrition Nutrition of DF forests as compared to annual plants Diagnoses of nutritional needs of DF trees Sources of nutrients in DF forest ecosystems Mechanisms by which the nutritional needs of DF trees are met Nutrient conservation retention processes by forest ecosystems
Advantages of Forests as a Perennial Plant System • Uptake can take place year around • Internal translocation of nutrients takes place • Growth of a tree builds on an existing structure • Nutrient loss from harvesting is significantly less
nutrients in D-fir Nutrient Content of DF tissue Tree component Nutrient content (%) N P K Ca Mg Foliage 1.40 0.21 0.85 0.45 0.11 Bark 0.29 0.07 0.31 0.42 0.13 Cones 0.65 0.13 1.26 0.06 0.10 Branches 0.36 0.07 0.21 0.51 0.05 Bole 0.08 0.01 0.05 0.10 0.05
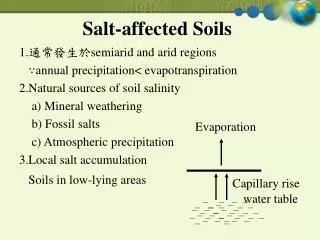
Sources of Nutrients • Weathering • Nitrogen fixation • Atmospheric additions • Mineralization • Fertilization
NUTSUPDM Nutrient Supply and Use POTENTIAL USE SOILSUPPLY ACTUAL USE REMOBILIZED UPTAKE FROM SOIL Source: Forest Nutrition Cooperatie
Slide Relative growth
Covered today1) Tree nutrition2) Nutrient limitiations 3) Risk-rating soils for biomass/nutrient removal4) Fertilization to maintain/enhance fertility5) Identifying nutrient deficiency 6) BMP for maintaining or enhancing soil fertility
Regional Long-term Site Productivity StudiesMineralSoil Carbon and Nitrogen to 0.6 m depth: Boistfort Grove
Sustainable Soil Productivity Removals effects on Nitrogen statusPotential Growth Reduction • Bole-only harvesting removes ~ 5% of N pool • Total-tree harvesting removes ~ 10% of N pool (after Johnson et al. 1982)
Nitrogen Risk Ratings - Generalized Concept • Increasing risk of nitrogen (N) limitations as A / T proportion increases… • A = Aboveground Total N Pool (kg/ha): • forest floor + understory vegetation + standing crop • S = Soil Total N pool (kg/ha) - rooting depth • T = A+S A = = T S = Evans, J.1999. Sustainability of forest plantations—the evidence. A review of evidence concerning the narrow-sense sustainability of planted forests. Report for the Department for International Development, London, UK. 64 p.
Nitrogen Risk Ratings - Generalized Concept Proportion of site N pool removed: Increasing risk (after Evans, 1999) Low Serious Imminent decline 0.1 0.3 0.5 Example 1: Fall River LTSP, Boistfort soil A/ T =1300 kg N /ha/ 14500 kg N/ha = 0.09 A = = T S =
Nitrogen Risk Ratings - Generalized Concept Proportion of site N pool removed: Increasing risk (after Evans, 1999) Low Serious Imminent decline 0.1 0.3 0.5 Example 1: Fall River LTSP, Boistfort soil A/ T =1300 kg N /ha/ 14500 kg N/ha = 0.09 A = = T S =
Nitrogen Risk Ratings - Generalized Concept Proportion of N pool removed: Increasing risk (after Evans, 1999) Low Serious Imminent decline 0.1 0.3 0.5 Example 2: Matlock LTSP, Grove series A/ T =605 kg N /ha/ 3705 kg N /ha = 0.16 A = = T S =
Nitrogen Risk Ratings - Generalized Concept Proportion of N pool removed: Increasing risk (after Evans, 1999) Low Serious Imminent decline 0.1 0.3 0.5 Example 2: Matlock LTSP, Grove series A/ T =605 kg N /ha/ 3705 kg N /ha = 0.16 A = = T S =
Covered today1) Tree nutrition2) Nutrient limitiations 3) Risk-rating soils for biomass/nutrient removal4) Fertilization to maintain/enhance fertility5) Identifying nutrient deficiency 6) BMP for maintaining or enhancing soil fertility
Diagnoses of Nutritional Requirements Daignostic indicators of deficency symptoms Foliage deficiency symptoms Foliage and soil analysis Nutrient uptake rates
Covered today1) Tree nutrition2) Nutrient limitiations 3) Risk-rating soils for biomass/nutrient removal4) Fertilization to maintain/enhance fertility5) Identifying nutrient deficiency 6) BMP for maintaining or enhancing soil fertility
N200 N300 Percent volume response N200-P88-S154 N200-P88-S168+ N100 N52-P12-K220 N rate (lb N/acre)
N+P N200-P88-S168+ N200-P88-S154 N100 N100 N300 N200 Percent volume response N52-P12-K220 N52-P12-K220 N rate (lb N/acre)
Installations of the PNW Stand Management Cooperative
(1) Overall results of SMC studies Response vs. N rate. Sidell thesis.
Results of RFNRP studies N response averaging 20% (unthinned) -30% (thinned) with 400 kg N, highly site dependent. Clearly, both response to N and other nutrients is site controlled. Indicates need for larger scale studies on a wide variety of sites to pin response to site variables. Effects of N fertilization appear to be very long-lived.
Covered today1) Tree nutrition2) Nutrient limitiations 3) Risk-rating soils for biomass/nutrient removal4) Fertilization to maintain/enhance fertility5) Identifying nutrient deficiency 6) BMP for maintaining or enhancing soil fertility
Nutrient Deficiency Levelssolution cultures (Walker and Gessel 1991) Nitrogen Phosphorus Potassium Calcium Magnesium Sulfur Element Douglas-fir Hemlock WR Cedar Sitka Spruce Abies 1.25 0.16 0.6 0.25 0.17 0.35 1.8 0.25 1.1 0.18 1.5 0.13 0.6 0.20 0.12 0.4 1.8 0.09 0.4 0.06 0.06 0.15 1.15 0.15 0.50 0.12 0.07
Estimating forest productivity and potential for response to fertilization: SMC/CIPS paired-tree fertilization project
Hypotheses • Soil and other will predict Douglas-fir response to N fertilization • Soil bulk density, porosity and texture • Soil organic matter and nutrient pools • Climate and soil temperature • Precipitation and soil moisture • Site index • LAI • Elevation, slope and slope position • Aspect • Stand stocking, type and development
Current Paired Tree Trials • 6 sites installed winter 2007 • 28 sites installed summer 2008 • 2 sites ready spring 2009 • Scouting more to fit into matrix glacial sedimentary igneous
Covered today1) Tree nutrition2) Nutrient limitiations 3) Risk-rating soils for biomass/nutrient removal4) Fertilization to maintain/enhance fertility5) Identifying nutrient deficiency 6) BMP for maintaining or enhancing soil fertility
Nitrogen Risk Ratings - Generalized Concept Proportion of site N pool removed: Increasing risk (after Evans, 1999) Low Serious Imminent decline 0.1 0.3 0.5 Example 1: Fall River LTSP, Boistfort soil A/ T =1300 kg N /ha/ 14500 kg N/ha = 0.09 A = = T S =