Download
1 / 1
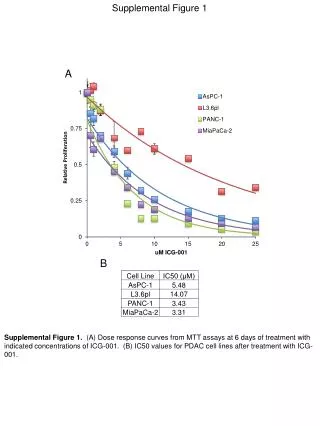
Dose-Response Curves and IC50 Values for PDAC Cell Lines Treated with ICG-001
10 likes | 124 Vues
This supplemental figure presents the dose-response curves from MTT assays after 6 days of treatment with various concentrations of ICG-001 (Panel A). Additionally, it displays the calculated IC50 values for different pancreatic ductal adenocarcinoma (PDAC) cell lines post-treatment with ICG-001 (Panel B). These data provide insights into the efficacy of ICG-001 against PDAC, highlighting its potential as a therapeutic agent.
Télécharger la présentation 
Dose-Response Curves and IC50 Values for PDAC Cell Lines Treated with ICG-001
An Image/Link below is provided (as is) to download presentation
Download Policy: Content on the Website is provided to you AS IS for your information and personal use and may not be sold / licensed / shared on other websites without getting consent from its author.
Content is provided to you AS IS for your information and personal use only.
Download presentation by click this link.
While downloading, if for some reason you are not able to download a presentation, the publisher may have deleted the file from their server.
During download, if you can't get a presentation, the file might be deleted by the publisher.
E N D
Presentation Transcript
Supplemental Figure 1 A B Supplemental Figure 1. (A) Dose response curves from MTT assays at 6 days of treatment with indicated concentrations of ICG-001. (B) IC50 values for PDAC cell lines after treatment with ICG-001.


More Related