Motion
Motion. Position, Speed and Velocity Graphs of Motion Acceleration. Learning Goals. Explain the meaning of motion. Describe an object’s position relative to a reference point. Use the speed formula. Tell the difference between speed and velocity.

Motion
E N D
Presentation Transcript
Motion • Position, Speed and Velocity • Graphs of Motion • Acceleration
Learning Goals • Explain the meaning of motion. • Describe an object’s position relative to a reference point. • Use the speed formula. • Tell the difference between speed and velocity.
Position is a variable given relative to an origin. Position, Speed and Velocity • The origin is the place where position equals 0. • The position of this car at 50 cm describes where the car is relative to the track.
Position and distance are similar but not the same. If the car moves a distance of 20 cm to the right, its new position will be 70 cm from its origin. Position, Speed and Velocity Distance = 20 cm New position
The variable speed describes how quickly something moves. To calculate the speed of a moving object divide the distance it moves by the time it takes to move. Position, Speed and Velocity
The units for speed are distance units over time units. This table shows different units commonly used for speed. Position, Speed and Velocity
When you divide the total distance of a trip by the time taken you get the average speed. On this driving trip around Chicago, the car traveled and average of 100 km/h. Average speed
A speedometer shows a car’s instantaneous speed. The instantaneous speed is the actual speed an object has at any moment. Instantaneous speed
Solving Problems How far do you go if you drive for two hours at a speed of 100 km/h? • Looking for: • …distance • Given: • …speed = 100 km/h time = 2 h • Relationships: • d = vt • Solution: • d = 100 km/h x 2 h = 200 km = 200 km
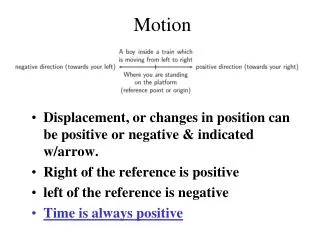
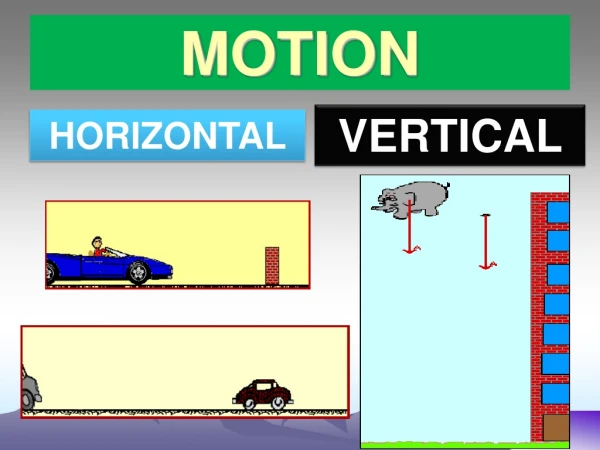
Vectors and velocity • Position uses positive and negative numbers. • Positive numbers are for positions to the right of the origin and negative numbers are for positions to the left the origin.
Vectors and velocity • Distance is either zero or a positive value.
Vectors and velocity • We use the term velocity to mean speed with direction.
Solving Problems A train travels at 100 km/h heading east to reach a town in 4 hours. The train then reverses and heads west at 50 km/h for 4 hours. What is the train’s position now? • Looking for: • …train’s new position • Given: • …velocity = +100 km/h, east ; time = 4 h • …velocity = -50 km/h, west ; time = 4 h • Relationships: • change in position = velocity × time
Solving Problems • Solution: • 1st change in position: • (+100 km/h) × (4 h) = +400 km • 2nd change in position: • (−50 km/h) × (4 h) = −200 km • Final position: • (+400 km) + (−200 km) = +200 km • The train is 200 km east of where it started.
Key Question: How is motion described and measured in physics? Investigation Time, Distance & Speed
Learning Goals • Construct and analyze graphs of position versus time, and speed versus time. • Recognize and explain how the slope of a line describes the motion of an object. • Explain the meaning of constant speed.
Graphs of Motion • Constant speed means the speed stays the same. • An object moving at a constant speed always creates a position vs. time graph that is a straight line.
Graphs of Motion • The data shows the runner took 10 seconds to run each 50-meter segment. • Because the time was the same for each segment, you know the speed was the same for each segment.
Graphs of Motion • You can use position vs. time graphs to compare the motion of different objects. • The steeper line on a position vs. time graph means a faster speed.
The slope of a line is the ratio of the “rise” to the “run”. Slope • The steepness of a line is measured by finding its slope.
Graphs of changing motion • Objects rarely move at the same speed for a long period of time. • A speed vs. time graph is also useful for showing the motion of an object that is speeding up or slowing down.
On the graph, the length is equal to the time and the height is equal to the speed. Graphs of changing motion • Suppose we draw a rectangle on the speed vs. time graph between the x-axis and the line showing the speed. • The area of the rectangle is equal to its length times its height.
Learning Goals • Define acceleration. • Determine acceleration by mathematical and graphical means. • Explain the role of acceleration in describing curved motion and objects in free fall.
Key Question: What is acceleration? Investigation Acceleration
Acceleration is the rate at which your speed (or velocity) changes. • If your speed increases by 1 meter per second (m/s) for each second, then your acceleration is 1 m/s per second. Acceleration
Acceleration is easy to spot on a speed vs. time graph. • Acceleration causes the line to slope up on a speed vs. time graph. Acceleration What is the bike’s acceleration?
If the hill is steeper, the acceleration is greater. Acceleration
There is zero acceleration at constant speed because the speed does not change. Acceleration
Speed and acceleration are not the same thing. You can be moving (non-zero speed) and have no acceleration (think cruise control). You can also be accelerating and not moving! A falling object begins accelerating the instant it is released. Acceleration
Acceleration describes how quickly speed changes. Acceleration is the change in speed divided by the change in time. Acceleration
An acceleration of 20 km/h/s means that the speed increases by 20 km/h each second. The units for time in acceleration are often expressed as “seconds squared” and written as s2. Speed and acceleration Can you convert this rate using conversion factors?
Solving Problems • A sailboat moves at 1 m/s. • A strong wind increases its speed to 4 m/s in 3 s. • Calculate acceleration.
Solving Problems • Looking for: • …acceleration of sailboat • Given: • …v1 = 1 m/s; v2 = 4 m/s; time = 3 s • Relationships: • a = v2 – v1/t • Solution: • a = (4 m/s – 1 m/s)/ 3 s = 1 m/s2
The word “acceleration” is used for any change in speed, up or down. Acceleration can be positive or negative. Acceleration on motion graphs
Positive acceleration adds more speed each second. Things get faster. Speed increases over time. Acceleration on speed-time graphs
Negative acceleration subtracts some speed each second. Things get slower. People sometimes use the word decelerationto describe slowing down. Acceleration on speed-time graphs
The position vs. time graph is a curve when there is acceleration. The car covers more distance each second, so the position vs. time graph gets steeper each second. Acceleration on position-time graphs
When a car is slowing down, the speed decreases so the car covers less distance each second. The position vs. time graph gets shallower with time. Acceleration on position-time graphs
An object is in free fall if it is accelerating due to the force of gravity and no other forces are acting on it. Free fall