Download
1 / 58
580 likes | 800 Vues
Vertical Scale and Texas Projection Measure. Dr. Stacy Daugherty – Edvance Research Laurie O’Donnell – Dickinson ISD. Scaling Test Performance. A raw score is often used as an indicator of a student’s performance on a particular test. Example: 41 out of 50 (or 82%)

E N D
Vertical Scale and Texas Projection Measure Dr. Stacy Daugherty – Edvance Research Laurie O’Donnell – Dickinson ISD
Scaling Test Performance • A raw score is often used as an indicator of a student’s performance on a particular test. • Example: 41 out of 50 (or 82%) • Raw scores may have different meaning between two tests if the tests are not of equal difficulty. • Does 41/50 (82%) indicate the same level of performance on an easy test as it does a hard test?
Raw Scores: Subtraction Test – 4th Grade Math Suppose Student A gets 4 correct out of the following 6 problems: 1. 13 – 2 = 2. 276 – 35 = 3. 45 – 23 = 4. 894 – 94 = 5. 637 – 16 = 6. 3,962 – 2,241 = Suppose Student B gets 4 correct out of the following 6 problems: • 13 – 8 = 2. 276 – 39 = 3. 45 – 7 = 4. 894 – 55 = 5. 637 – 140 = 6. 3,962 – 2,974 = Question: If Student A and Student B both get 67% correct (raw score), have they demonstrated the same level of learning? 3
Scale Score A scale score is a conversion of the raw score onto a “scale” that is common to all test forms for the assessment. • The scale score takes into account the difficulty level of the specific set of questions. 36/50 3750 41/50 Harder Test Form Easier Test Form
TAKS Horizontal Scale For TAKS, the scale scores were defined such that the Met Standard and Commended Performance cuts were always to same scale values across forms and grades • Met Standard = 2100 • Commended = 2400 This is known as a horizontal scale
Horizontal Scales Limitations of horizontal scales: • Scale scores across test forms can be compared within a grade, but not across grades for a subject. • Standards (Met Standard and Commended) cannot be numerically compared across grade levels • Example: 2100 in Grade 5 ≠ 2100 in Grade 6 • It is difficult to evaluate individual student progress from grade to grade.
Vertical Scale A vertical scale score • Shows how well a student did on the TAKS - calculated from the number of questions a student answered correctly • Can be numerically compared across different grades for the same subject • Changes in a student’s vertical scale scores show academic progress over time
Vertical Scale Score • Potential score range from approximately 0 to 1000 • Vertical scale scores in grades 3-6 will be preceded by an “E” or an “S” to indicate language Grade 4 mathematics examples • E – 562 • S - 585
Performance Standards on Vertical Scale • SB 1031 required a vertical scale for grades 3-8 in reading and mathematics • Performance standards were reviewed and some will be increased between 2009 and 2010 to reflect an appropriate increase in expectations across grades • Vertical scale scores in 2009 reflect the current cut points • Vertical scale scores in 2010 will reflect revised (higher) cut points
Vertical Scale – Required Adjustments to Performance Standards • Aligning the current horizontal scale scores (2100 for Met Standard and 2400 for Commended) to vertical scale scores will require the “cutpoints” for “Met Standard” and “Commended” on some assessments to be increased • Will be applied beginning in Spring 2010 • Will be reported beginning in Spring 2009
Grade 8 Reading Example • Spring 2009 • Met Standard = 2100 • Met Standard = 670 (previous cut score) • Spring 2010 • Met Standard = 700 (revised cut score) • Additional 4 questions needed to pass in 2009
Grade 6th Reading Example • Spring 2009 • Met Standard = 2100 • Met Standard = 614 (previous cut score) • Spring 2010 • Met Standard = 644 (revised cut score) • Additional 3 questions needed to pass in 2009
Vertical Scale Score – Math Example Uses 2009 standards
Exercise 1 – VS Score - Reading Hint: Use 2009 standards this year to determine Met Standard.
Spring 2009 Reporting Changes • Same basic reporting information as past years • Old scale with 2100 as Met and 2400 as Commended Performance • Same graph on Confidential Student Report (CSR) • New Information • Vertical scores added near Lexile/Quantile scores • Data file • Vertical scale scores for 2009 • Vertical scale scores for 2008 (converted) • Parent brochure explaining new information • Blackline master information
Grade Level Vertical Scale(Interpreting the Increases in Performance Standard) Vertical Scale Score (Note: In 2010, a Vertical Scale Score of 670 For 8th Grade Reading = Does NOT Meet Std) Horizontal Scale Score 2100 = Met Standard
Vertical Scale Parent Script Your child received a vertical scale score for both reading and math. This score is based on the number of questions your child answered correctly. You can use your child’s vertical scale score to compare performance from one year to the next in the same subject area. This score will help you keep track of your child’s progress in reading and math. This is how we track her progress: 1. Compare this year’s score to last year’s to measure growth. 2. Compare her growth to the expected growth. 3. Compare her score to the performance standards. Additional information is available on the TEA website. Computers are available on campus for parents at ….
Which TAKS Will NOT Have a Vertical Scale? • Writing • Science • Social Studies • High School Assessments • End-of-Course Assessments
What About Other Assessments? • TAKS (Accommodated) will be reported on the same vertical scale as TAKS • TELPAS will be reported on a vertical scale with score range approx. 0 – 1000 • TEA is considering a vertical scale for TAKS-M • There are no plans currently for a vertical scale for TAKS-Alt or EOC
Vertical Scales Expected Growth Amounts
Texas Projection Measure (TPM)
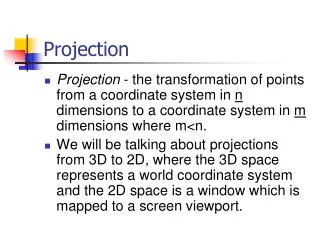
Why a Projection Model? To offer alternative approaches to demonstrating student achievement that meet both state and NCLB goals
How the Projection Model Works • TPM estimates whether a student is likely to pass TAKS assessments at a future grade – 5th, 7th (writing only), 8th, or 11th • TAKS • TAKS (Accommodated) • LAT • TPM is based on • Student’s current performance on TAKS • TAKS scores of all the students on the campus that the student attends
TPM Content Areas • TPM will be reported on • Mathematics • Reading/ELA • Science • Social Studies • Writing
TPM Predictors • Uses three predictors for reading and mathematics projections: • Student’s current year scale score in reading • Student’s current year scale score in mathematics • Average campus scale score in the projection subject (i.e. reading for reading, math for math) • For science, social studies, and writing, add the student’s scale score for that subject for a total of four predictors
Equation Reading Prediction Equation for next high-stakes grade: (6th grade projecting to 8th grade) ReadingScore_2010 = Constant + (Rd-Co * Rd SS) + (Math-Co * Math SS) + (C-Mean_Co * C-Rd-SS) Constant = a value determined when the coefficients are developed annually Rd-Co = coefficient calculated from prior year’s grade 6 reading scores Rd SS = student’s current year scale score in reading Math-Co = coefficient calculated from prior year’s grade 6 math scores Math SS = student’s current year scale score in math C-Mean_Co = coefficient calculated from prior year’s campus averages in grade 6 reading C-Rd-SS = prior year’s campus average in grade 6 reading
Equation: 6th Reading Projected to 8th Reading Projected Reading Score2010 = Constant + (Rd-Co * Rd-SS) + (Math-Co * Math SS) + (C-Mean-Co * C-Rd-SS)
Equation: 6th Reading Projected to 8th Reading Equation Projected Reading Score2010 = 225.28 + (0.4770 * Rd-SS) + (0.2511 * Math SS) + Texas Projection Measure information and resources: See this site for TAKS Mean Scores for campuses and districts http://www.tea.state.tx.us/index3.aspx?id=3688&menu_id3=793
Equation: 6th Reading Projected to 8th Reading Projected Reading Score2010 = 225.28 + (0.4770 *650) + (0.2511 *550) + (0.0784 *650)
Equation: 6th Reading Projected to 8th Reading Projected Reading Score2010 = 225.28 + 310.05 + 138.105 + 50.96 724.395 If the projected score is equal to or greater than the Met Standard cut score, then the student IS predicted to meet the standard at the next high-stakes grade level.
Grade 6 to Grade 8 Reading Note. Grade 8: Met Standard (Reading)=700, Commended Performance (Reading)=850; Grade 6: Met Standard (Reading)=644, Commended Performance (Reading)=797, Met Standard (Math)=637, Commended Performance (Math)=783
Equation:5th Science Projected to 8th Science Projected Science Score2010 = Constant + (Rd-Co * Rd-SS) + (Math-Co * Math-SS) + (Science-Co * Science-SS) + (C-Mean-Co * C-Science-SS)
The Equation Section is Finished Work it out yourself or use the TPM calculator link below http://forwardfocus.pearson.com/tpmcalculator/
Distinguishing Vertical Scales from TPM Vertical Scales Vertical Scales will reflect individual student growth from year-to-year • Student’s previous year performance is significant in fully utilizing Vertical Scales • Primary use: instruction • What is working? • What is not working?
Distinguishing Vertical Scales from TPM Texas Projection Measure • TPM is a projection of a future TAKS score based on a student’s current TAKS scores • Similar to projecting how tall a 10-year old child will be when he/she reaches 18 • Uses current student performance data • Spring 2009 test results • Student’s previous year performance is irrelevant to TPM • TPM formula does NOT include an analysis of whether an individual student made progress from the previous year to the current year • Primary use: accountability • Students counted as “successful” even though they Did Not Meet Standard on the test
Which students will have predicted performances? • Students must have a current, valid score in the TPM projection content area – Reading/ELA and Math. • Students must have taken TAKS, TAKS (Accommodated), or LAT for all content-area predictors. • Students must have taken the same language version for all content area predictors. • To be decided and announced this fall… • A TPM methodology to allow two different languages in 2010) • TPM for students who take TAKS-M in grades 4, 7, and 10
Which students will have predicted performances? Current year Reading/ELA score for TAKS Current year Math score for TAKS YES! Current year Reading score for TAKS-Acc Current year Math score for TAKS-M NO! Current year Reading score for Spanish TAKS Current year Math score for TAKS-Acc NO! Current year Reading score for Spanish TAKS Current year Math score for Spanish TAKS YES! Note: using current information on 9/18/09 44
How will this affect state and federal accountability? All students who meet proficiency OR who are predicted to meet proficiency in the next high-stakes grade level will be counted in the “Met Standard” group.
Campus A Spring 2009 Students who Met Standard in 2009 Yes Yes Yes Yes Yes No No No No No % Met Standard based on assessment results = 50% Students who are Predicted to Meet Standard based on 2009 scores Yes Yes Yes Yes Yes Yes Yes No No No 5 students Met Standard + 2 students who Did Not Meet Standard (but are predicted to) 7 students count as “Met Standard” % Met Standard = 70% 46
Reporting 2009 • Online reports • Student level • 2008 vertical scale score • 2009 vertical scale score • Projection (yes or no) • Summary reports for campus, district, region, and state levels (Expected soon) • Number and percent Met Standard • Number and percent Met Standard with TPM • Number and percent Met Standard or Met Standard with TPM
Grade Level Vertical Scale(Reading a CSR in 2009) Vertical Scale Score Horizontal Scale Score and “Met Std” Indicator TPM – Projected to Meet Std
TPM Parent Script Your child has received Texas Projection Measure (TPM) scores in addition to her TAKS scores. These new TPM scores let us know if your child is on track to pass at grade __ (the next high-stakes grade, and grade 7 Writing). According to the TPM score on the Confidential Student Report, your child is projected to pass/not to pass. We compare the projected score to the standard for the grade and subject. For students who are not projected to pass, remediation will be offered, such as …. Additional information is available on the TEA website. Computers are available on campus for parents at ….
Reporting Spring 2010 • For grades 5 and 8, any student retesting will have projections recalculated for all subjects • Grade 8 science will have a TPM • TAKS-M students in grades 4, 7, and 10 will have projections