Bivariate Description
Bivariate Description. Heibatollah Baghi, and Mastee Badii. OBJECTI VES. Define bivariate and univariate statistical tests. Explain when to use correlational techniques to answer research questions. Understand measure of Pearson Product Moment Correlation Coefficient (Pearson’s r).


Bivariate Description
E N D
Presentation Transcript
Bivariate Description Heibatollah Baghi, and Mastee Badii
OBJECTI VES • Define bivariate and univariate statistical tests. • Explain when to use correlational techniques to answer research questions. • Understand measure of Pearson Product Moment Correlation Coefficient (Pearson’s r).
Definitions • Univariate: examination of variable’s frequency distribution, central tendency, and variability. • Bivariate: examination of two variables simultaneously. • Is SES related to intelligence? • Do SAT scores have anything to do with how well one does in college? • The question is: do these variables correlate or covary?
Typical Situations • Two nominal variables • Gender and readmission status • A nominal and interval/ratio variables • Delivery type and weight of child • Bed rest and weight gain during pregnancy • Two interval ratio variables • Respiratory function and extent of anxiety
Cross Tabulation • Describes relationship between two nominal variables • Two dimensional frequency distribution Also appropriate if either or both variables are ordinal-level with a small number of categories
Elements of Cross Tabulation Column Row
Elements of Cross Tabulation Cell count Row % Column % Total %
Elements of Cross Tabulation Marginal Joint distribution Marginal
Group Mean Comparison • Describes a nominal variable and an interval/ratio variable
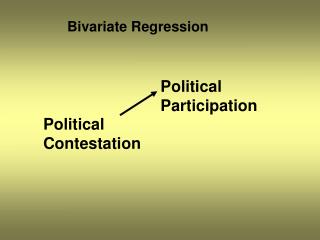
Linear Association • The correlation coefficient is a bivariate statistic that measures the degree of linear association between two interval/ratio level variables. (Pearson Product Moment Correlation Coefficient)
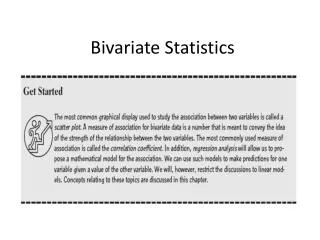
Scatter plot • Reveals the presence of association between two variables. The stronger the relationship, the more the data points cluster along an imaginary line. • Indicates the direction of the relationship. • Reveals the presence of outliers.
Covariance of X & Y Standard Deviation of X Standard Deviation of Y Correlation Formula
Limitation of the Covariance It is metric-dependent
Properties of Pearson r • r is metric-independent • r reflects the direction of the relationship • r reflects the magnitude of the relationship
What does positive correlation mean? • Scores above the mean on X tend to be associated with scores above the mean on Y • Scores below the mean on X tend to be accompanied by scores below the mean of Y • Note for this reason deviation score is an important part of Covariance
What does negative correlation mean? • Scores above the mean on X tend to be associated with scores below the mean on Y • Scores below the mean on X tend to be accompanied by scores above the mean of Y.
Strength of association r2 = Coefficient of determination 1 – r2 = Coefficient of non-determination
Take Home Lessons • Always make a scatter plot • See the data first • Examining the scatter plot is not enough • A single number can represent the degree and direction of the linear relation between two variables