Light scatter
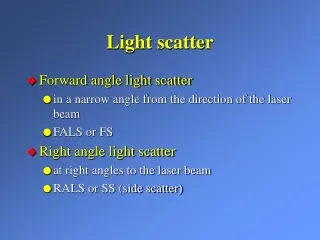
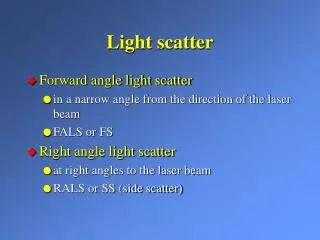
Light scatter. Forward angle light scatter in a narrow angle from the direction of the laser beam FALS or FS Right angle light scatter at right angles to the laser beam RALS or SS (side scatter). FS detector. laser. blocker bar. Forward light scatter. Light Scatter.

Light scatter
E N D
Presentation Transcript
Light scatter • Forward angle light scatter • in a narrow angle from the direction of the laser beam • FALS or FS • Right angle light scatter • at right angles to the laser beam • RALS or SS (side scatter)
FS detector laser blocker bar Forward light scatter
Light Scatter • The intensity of scatter is proportional to the size, shape and optical homogeneity of cells (or other particles) • It is strongly dependent on the angle over which it is measured • particularly with forward scatter
Light Scatter • Forward scatter tends to be more sensitive to the size and surface properties • can be used to distinguish live from dead cells • Side scatter tends to be more sensitive to inclusions within cells • can be used to distinguish granulated cells from non-granulated cells
Gating • Set a region on a histogram or cytogram • IF cell IN region THEN show another property
Cell selection by gating ‘Gating’ on the lymphocytes. IF cell has light scatter in R1 THEN show on CD4/CD8 cytogram lymphocytes
Triggering the electronics signal threshold time
I spherical distance cross-section elliptical Shape of the laser beam Focus the laser beam with: • spherical lens - circular cross-section • cross cylindrical lens pair - elliptical X-section
signal time Pulse shape analysis flow laser Integrated area = total fluorescence Signal peak Signal width = beam width + cell diam.
Pulse shape analysis two cells single cells
DNA analysis by flow cytometry Michael G. Ormerod m.g.ormerod@btinternet.com
DNA content Ploidy Cell cycle
DNA Probes Use DNA probes that are stoichiometric - that is, the number of molecules of probe bound is equivalent to the quantity of DNA
Dyes for DNA cell cycle analysis • Propidium iodide • Excited at 488 nm; fluoresces red (617 nm) • easily combined with fluorescein stain • also stains RNA • DRAQ5 • Max. excitation at 646 nm; can be excited at 488 nm; fluoresces in deep red at 680 nm max • Taken up by live cells
Dyes for DNA cell cycle analysis • Hoechst dyes • excited by uv; fluoresce blue • DNA specific - bind to AT • Hoechst 33342 can be used to stain viable cells • DAPI • excited by uv; fluoresce blue • DNA specific
Definitions & Terms • DNA Ploidy • Related to the quantity of DNA in a cell • DNA Index • Ratio between the mean DNA content of the test cells to the mean DNA content of normal diploid cells, in G0/G1phase • Coefficient of Variation (CV) • 100*SD/mean DNA • Usually measured on G1/G0 cells
FNA of human breast carcinoma PI stain Cell number DNA DNA content - measuring ploidy & SPF G1 tumour normal G2 S
DNA analysis of the cell cycle Following changes in the cell cycle
Quality control of DNA measurement • Sample preparation • Instrument alignment • Correct data analysis
Using propidium iodide for DNA analysis • Excited at 488 nm (argon-ion) • Fluoresces red • Does not cross intact plasma membrane • Permeabilise with detergent or • Fix in 70% ethanol or • Fix in paraformaldehyde followed by ethanol • Treat with RNase
Sample preparation for DNA analysis • Fixed cells • Samples can be stored • Needed when adding antibody stain • Quality may be reduced • Permeabilisied cells or nuclei • Use fresh or frozen samples, limited storage time • High quality achievable (Vindelov method)
DNA measurement Use linear amplification • Cell cycle is linear, not logarithmic • Relevant information occupies more of the histogram • Cell cycle algorithms assume a linear scale
Instrument alignment • Check daily using standard fluorescent beads • Correct alignment essential • (Some misalignment can be tolerated with immunofluoresence measurement - not DNA)
DNA measurement Use linear amplification • Cell cycle is linear, not logarithmic • Relevant information occupies more of the histogram • Cell cycle algorithms assume a linear scale
Quality control of DNA measurement Measure the spread of the distribution across the G1/G0 peak as coefficient of variation (cv)
Human breast carcinoma cells prepared by the Vindelov method. PI stain. (Data supplied by Gyda Otteson & Ib Christensen, Finsen Laboratory, Copenhagen) D C, T cv = 1% C T A D cv = 1.2% D C T DNA measurement C 1.2% T 1.0% D 1.0% A 2.2%
DNA histogram • Measure DNA content • Problem with clumps • 2 cells in G1 = 1 cell in G2 • Distinguish by pulse shape analysis
Shape of the laser beam focus with: • spherical lens - circular cross-section • cross cylindrical lens pair - elliptical cross-section I spherical distance cross-section elliptical
Flow Cytometry • Pulse shape analysis Integrated area = total fluorescence cell beam Signal peak Signal width = beam width + cell diam. PMT voltage time
flow width Pulse shape analysis G1 G2 2 x G1 laser 2x signal ht area time
Pulse shape analysis single DNA peak clumps DNA area
ungated DNA width gated DNA area Pulse shape analysis clumps single
Measuring cell proliferation using the BrdUrd/anti-BrdUrd method
Measuring cell proliferation • DNA histogram • BrdUrd/anti-BrdUrd • Hoechst/PI/BrdUrd • Dilution of label
DNA histogram • Static measurement of the cell cycle • First choice • Easy to combine with antibody stain
S phase slow down G2 block Following changes in the cell cycle Cisplatin Genotoxic drug
BrdUrd/anti-BrdUrd • Pulse label with BrdUrd (30 min) • Harvest cells at different times • Fix cells • Denature DNA (acid, heat or UV) • Label with anti-BrdUrd and PI
BrdUrd/anti-BrdUrd Cell cycle analysis V79 cells (data supplied by G. D. Wilson,, CRC Gray Laboratories) S BrdUrd/FITC G2 G1 DNA/PI
BrdUrd/anti-BrdUrd • Dynamic analysis • more complex procedure - denaturation of DNA • difficult to combine with another antibody
Exposure of the BrdUrd • Denature DNA with 2 M HCl or heat • Partially digest DNA with endonuclease/exonuclease • UV irradiation - label strand breaks with Tdt/BrdUrd (SBIP) • Li et al., (1994) Int. J. Oncol., 4, 1157. • UV irradiation in the presence of Hoechst 33258 • Hammers et al. (2000) Cytometry, 40, 327.
BrdUdr/anti-BrdUdr 8 h 4 h 0 h Cell cycle analysis BrdUdr/FITC S G2 G1 DNA/PI
BrdUdr/anti-BrdUdr 4 h 8 h Measurement of proliferation 0 h S BrdUdr/FITC G1 G2 DNA/PI V79 cells (data supplied by G. D. Wilson,, CRC Gray Laboratories)
4 1 7 8 5 2 3 9 6 BrdUrd/anti-BrdUrd V79 cells (data supplied by G. D. Wilson,, CRC Gray Laboratories) BrdUrd/FITC DNA
No drug Drug Drug effects on cell cyclepulse label after treatment Incubated for 2 h with cisplatin 24 h earlier Cells prepared in Institute for Cancer Studies, Sheffield
Nuclear & cytoplasmic antigens Michael G. Ormerod m.g.ormerod@btinternet.com
Staining intracellular antigens • To detect intracellular antigens, the cells must be fixed or permeabilised. • Method used depends on • The antigen to be detectedThe combination of stains used in a multi-parameter analysis
Staining intracellular antigens • The epitope on a particular antigen may be sensitive to fixation • Consequently, there is no standard procedure for preparing cells • A procedure has to be established for each new antibody.
Fixatives for intracellular antigens • Fixatives may be divided into two broad classes • Those that cross-link proteins, such as paraformaldehyde • Those that coagulate proteins and extract lipids, such as ethanol, methanol and acetone • The two may be combined - e.g. paraformaldehyde followed by ethanol