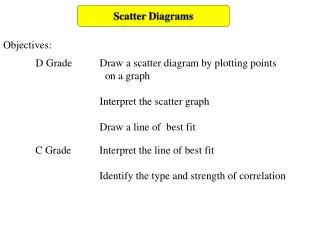
Scatter Diagrams
Scatter Diagrams. Thursday, 09 June 2011. Example Ten Students in class 6 sat a mock Mathematics SATS test and three weeks later sat a second SATs test to check on improvement. The results are shown below. Represent the information provided on a scatter diagram

Scatter Diagrams
E N D
Presentation Transcript
Scatter Diagrams Thursday, 09 June 2011
Example Ten Students in class 6 sat a mock Mathematics SATS test and three weeks later sat a second SATs test to check on improvement. The results are shown below. Represent the information provided on a scatter diagram Have results improved for this ten students.
Example The table below shows the number of tills open and the number of customers queuing to be served as a local supermarket over seven observed time during the week. Plot a scatter diagram to represent this data Draw a line of best fit on your scatter diagram Using the scatter diagram Estimate the number of people queuing when there are six tills open. Explain why we have no figure for 20 tills open
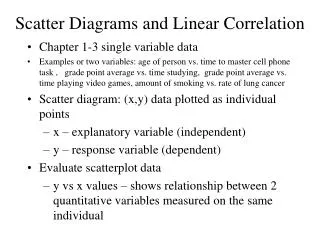
Correlation There are essentially two types of correlation two consider when looking at any relationship (pattern) between two variables. Positive Correlation Negative correlation No Correlation As one variable increases in value so does the other As one variable decreases in value so does the other And if it fails to fall in either of the above then...
Example Over the years Mr Cooper recorded the number of mistakes made at the board whilst teaching mathematics The table below shows the years of experience in teaching mathematics and the number of mistakes made in that school year. Represent this data on a scatter diagram Draw a line of best fit. Using the scatter diagram how many mistakes was Mr Cooper likely to make at the board in his tenth year?
Example In a particular school 12 students sat both a English exam and a History exam. The results are as follows: Draw a scatter diagram to represent this data. What relationship is there between the marks obtained in English and the marks obtained in History? Draw on your scatter diagram a line of best fit Adam was Absent for his English Test but scored 43% on his History test. What score do you think he would have achieved on the English test?