Scatter Diagrams
140 likes | 404 Vues
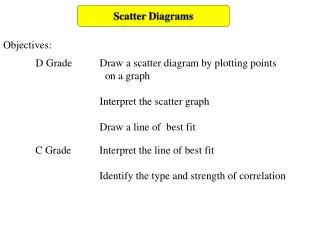
Scatter Diagrams. A scatter plot is a graph that may be used to represent the relationship between two variables. Also referred to as a scatter diagram . Dependent and Independent Variables.

Scatter Diagrams
E N D
Presentation Transcript
Scatter Diagrams A scatter plot is a graph that may be used to represent the relationship between two variables. Also referred to as a scatter diagram.
Dependent and Independent Variables A dependent variable is the variable to be predicted or explained in a regression model. This variable is assumed to be functionally related to the independent variable.
Dependent and Independent Variables An independent variable is the variable related to the dependent variable in a regression equation. The independent variable is used in a regression model to estimate the value of the dependent variable.
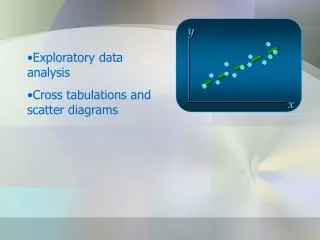
Two Variable Relationships(Figure 11-1) Y X (a) Linear
Two Variable Relationships(Figure 11-1) Y X (b) Linear
Two Variable Relationships(Figure 11-1) Y X (c) Curvilinear
Two Variable Relationships(Figure 11-1) Y X (d) Curvilinear
Two Variable Relationships(Figure 11-1) Y X (e) No Relationship
Correlation The correlation coefficient is a quantitative measure of the strength of the linear relationship between two variables. The correlation ranges from + 1.0 to - 1.0. A correlation of 1.0 indicates a perfect linear relationship, whereas a correlation of 0 indicates no linear relationship.
Correlation SAMPLE CORRELATION COEFFICIENT where: r = Sample correlation coefficient n = Sample size x = Value of the independent variable y = Value of the dependent variable
Correlation(Example 11-1) Correlation between Years and Sales Excel Correlation Output (Figure 11-5)
Correlation TEST STATISTIC FOR CORRELATION where: t = Number of standard deviations r is from 0 r = Simple correlation coefficient n = Sample size
Correlation Significance Test(Example 11-1) Rejection Region /2 = 0.025 Rejection Region /2 = 0.025 Since t=4.752 > 2.048, reject H0, there is a significant linear relationship
Correlation Spurious correlation occurs when there is a correlation between two otherwise unrelated variables.