Download
1 / 9
90 likes | 198 Vues
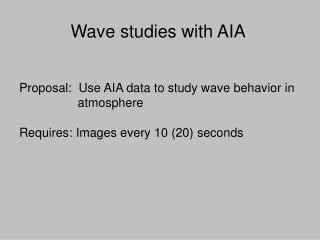
This proposal outlines a research study using AIA data to investigate wave behavior in the atmosphere. By capturing images every 10-20 seconds, we aim to analyze wave dynamics and their contributions to the upper atmosphere. The study includes constraints from travel times on magnetic field topology, dispersion curves to identify wave types, and features like chromospheric energy flux and acoustic portals. By leveraging 107 hours of Na & K data from South Pole II and monitoring event rates at various frequencies, we will advance our understanding of atmospheric dynamics influenced by wave behavior.

E N D
Wave studies with AIA Proposal: Use AIA data to study wave behavior in atmosphere Requires: Images every 10 (20) seconds
I. Travel times provide constraint on magnetic field topology 7 mHz - ~1 surface 4 mHz - B inclination angle 107 hours of Na & K Data from South Pole
II. Seismology Dispersion curves should allow identification of wave type
III. Wave contribution to dynamics of upper atmosphere EIT 19.5 nm - “Event” 4 mHz - “wave travel time” Detect magnetic reconnection?
“Monitoring the chromospheric energy flux” 107 hours of South Pole data
Potential overlap with Coronal Seismology “Acoustic Portals” Multi-colored overlay of 3(red), 4(green), & 5(blue) mHz PTTs • 3minute running waves leaking from sunspot umbra. Progression to lower frequencies (5minute) visible in the penumbra. “coronal” wave leakage. • “acoustic portals” on SG boundaries. • “rainbows” in SG interiors advected magnetic dipoles? Need: full disk, long duration obs. In B, V and I