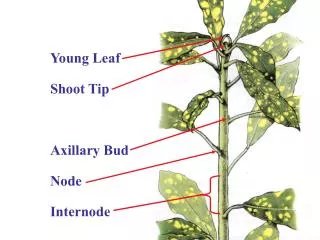
Stem & Leaf Plots
Stem-and-leaf plots are a useful method for organizing numerical data by breaking each number into a "stem" and a "leaf." The leaf represents the last digit (ones place), while the stem includes all preceding digits. For example, in the number 67, the stem is 6 and the leaf is 7. This method allows for a quick visualization of data distribution. By placing each leaf next to its corresponding stem, one can easily interpret ranges and frequency. This plotting technique is especially beneficial for displaying small datasets, such as test scores ranging from 60 to 100.

Stem & Leaf Plots
E N D
Presentation Transcript
Stem & Leaf Plots A stem – and – leaf plot is another method for organizing data. Each number in the data is broken up into a “stem” and a “leaf”. The “leaf” IS ALWAYS the last digit in the number ( the ones place ). The “stem” IS ALWAYS the numbers preceding the last digit ( no matter how many are there ).
Stem & Leaf Plots A stem – and – leaf plot is another method for organizing data. Each number in the data is broken up into a “stem” and a “leaf”. The “leaf” IS ALWAYS the last digit in the number ( the ones place ). The “stem” IS ALWAYS the numbers preceding the last digit ( no matter how many are there ). EXAMPLE # 1 : This stem and leaf plot shows the test scores ranging from 60 to 100. 6 0 5 7 7 5 8 0 5 5 8 9 9 0 2 4 5 5 7 10 0 0 0
Stem & Leaf Plots A stem – and – leaf plot is another method for organizing data. Each number in the data is broken up into a “stem” and a “leaf”. The “leaf” IS ALWAYS the last digit in the number ( the ones place ). The “stem” IS ALWAYS the numbers preceding the last digit ( no matter how many are there ). EXAMPLE # 1 : This stem and leaf plot shows the test scores ranging from 60 to 100. 6 0 5 7 To create the data list, just put each “leaf” behind the “stem” to the left of the vertical line… 7 5 8 0 5 5 8 9 9 0 2 4 5 5 7 10 0 0 0
Stem & Leaf Plots A stem – and – leaf plot is another method for organizing data. Each number in the data is broken up into a “stem” and a “leaf”. The “leaf” IS ALWAYS the last digit in the number ( the ones place ). The “stem” IS ALWAYS the numbers preceding the last digit ( no matter how many are there ). EXAMPLE # 1 : This stem and leaf plot shows the test scores ranging from 60 to 100. 6 0 5 7 60 To create the data list, just put each “leaf” behind the “stem” to the left of the vertical line… 7 5 8 0 5 5 8 9 9 0 2 4 5 5 7 10 0 0 0
Stem & Leaf Plots A stem – and – leaf plot is another method for organizing data. Each number in the data is broken up into a “stem” and a “leaf”. The “leaf” IS ALWAYS the last digit in the number ( the ones place ). The “stem” IS ALWAYS the numbers preceding the last digit ( no matter how many are there ). EXAMPLE # 1 : This stem and leaf plot shows the test scores ranging from 60 to 100. 6 0 5 7 60 , 65 To create the data list, just put each “leaf” behind the “stem” to the left of the vertical line… 7 5 8 0 5 5 8 9 9 0 2 4 5 5 7 10 0 0 0
Stem & Leaf Plots A stem – and – leaf plot is another method for organizing data. Each number in the data is broken up into a “stem” and a “leaf”. The “leaf” IS ALWAYS the last digit in the number ( the ones place ). The “stem” IS ALWAYS the numbers preceding the last digit ( no matter how many are there ). EXAMPLE # 1 : This stem and leaf plot shows the test scores ranging from 60 to 100. 6 0 5 7 60 , 65 , 67 To create the data list, just put each “leaf” behind the number to the left of the vertical line… 7 5 8 0 5 5 8 9 9 0 2 4 5 5 7 10 0 0 0
Stem & Leaf Plots A stem – and – leaf plot is another method for organizing data. Each number in the data is broken up into a “stem” and a “leaf”. The “leaf” IS ALWAYS the last digit in the number ( the ones place ). The “stem” IS ALWAYS the numbers preceding the last digit ( no matter how many are there ). EXAMPLE # 1 : This stem and leaf plot shows the test scores ranging from 60 to 100. 6 0 5 7 60 , 65 , 67 7 5 75 8 0 5 5 8 9 9 0 2 4 5 5 7 10 0 0 0
Stem & Leaf Plots A stem – and – leaf plot is another method for organizing data. Each number in the data is broken up into a “stem” and a “leaf”. The “leaf” IS ALWAYS the last digit in the number ( the ones place ). The “stem” IS ALWAYS the numbers preceding the last digit ( no matter how many are there ). EXAMPLE # 1 : This stem and leaf plot shows the test scores ranging from 60 to 100. 6 0 5 7 60 , 65 , 67 7 5 75 8 0 5 5 8 9 80 , 85 , 85 , 88 , 89 9 0 2 4 5 5 7 10 0 0 0
Stem & Leaf Plots A stem – and – leaf plot is another method for organizing data. Each number in the data is broken up into a “stem” and a “leaf”. The “leaf” IS ALWAYS the last digit in the number ( the ones place ). The “stem” IS ALWAYS the numbers preceding the last digit ( no matter how many are there ). EXAMPLE # 1 : This stem and leaf plot shows the test scores ranging from 60 to 100. 6 0 5 7 60 , 65 , 67 7 5 75 8 0 5 5 8 9 80 , 85 , 85 , 88 , 89 9 0 2 4 5 5 7 90 , 92 , 94 , 95 , 95 , 97 10 0 0 0
Stem & Leaf Plots A stem – and – leaf plot is another method for organizing data. Each number in the data is broken up into a “stem” and a “leaf”. The “leaf” IS ALWAYS the last digit in the number ( the ones place ). The “stem” IS ALWAYS the numbers preceding the last digit ( no matter how many are there ). EXAMPLE # 1 : This stem and leaf plot shows the test scores ranging from 60 to 100. 6 0 5 7 60 , 65 , 67 7 5 75 8 0 5 5 8 9 80 , 85 , 85 , 88 , 89 9 0 2 4 5 5 7 90 , 92 , 94 , 95 , 95 , 97 10 0 0 0 100 , 100 , 100
Stem & Leaf Plots To create a stem and leaf plot from a list of data, we first must get the data in ascending order ( small to big ).
Stem & Leaf Plots To create a stem and leaf plot from a list of data, we first must get the data in ascending order ( small to big ). EXAMPLE # 2 : Create a stem – and – leaf plot from the following test scores. 77 , 83 , 71 , 66 , 97 , 77 , 86 , 62 , 75 , 93 , 87
Stem & Leaf Plots To create a stem and leaf plot from a list of data, we first must get the data in ascending order ( small to big ). EXAMPLE # 2 : Create a stem – and – leaf plot from the following test scores. 77 , 83 , 71 , 66 , 97 , 77 , 86 , 62 , 75 , 93 , 87 Get your data in ascending order … 62 , 66 , 71 , 75 , 77 , 77 , 83 , 86 , 87 , 93 , 97
Stem & Leaf Plots To create a stem and leaf plot from a list of data, we first must get the data in ascending order ( small to big ). Now identify all the “stems”. All numbers that appear IN FRONT of the last digit. EXAMPLE # 2 : Create a stem – and – leaf plot from the following test scores. 77 , 83 , 71 , 66 , 97 , 77 , 86 , 62 , 75 , 93 , 87 62 , 66 , 71 , 75 , 77 , 77 , 83 , 86 , 87 , 93 , 97 Identify your “stems “
Stem & Leaf Plots To create a stem and leaf plot from a list of data, we first must get the data in ascending order ( small to big ). Now identify all the “stems”. All numbers that appear IN FRONT of the last digit. EXAMPLE # 2 : Create a stem – and – leaf plot from the following test scores. 62 , 66 , 71 , 75 , 77 , 77 , 83 , 86 , 87 , 93 , 97 List them on the left side of the vertical line ( no need to repeat any… ) 6 7 8 9
Stem & Leaf Plots Now identify all your “leafs”. Again, it is the last digit… EXAMPLE # 2 : Create a stem – and – leaf plot from the following test scores. 62 , 66 , 71 , 75 , 77 , 77 , 83 , 86 , 87 , 93 , 97 6 7 8 9
Stem & Leaf Plots Now identify all your “leafs”. Again, it is the last digit… EXAMPLE # 2 : Create a stem – and – leaf plot from the following test scores. 62 , 66 , 71 , 75 , 77 , 77 , 83 , 86 , 87 , 93 , 97 6 7 8 9
Stem & Leaf Plots Now identify all your “leafs”. Again, it is the last digit… EXAMPLE # 2 : Create a stem – and – leaf plot from the following test scores. 62 , 66 , 71 , 75 , 77 , 77 , 83 , 86 , 87 , 93 , 97 List them next to their stem…and you must repeat if multiple leafs occur… 6 2 6 7 1 5 7 7 3 6 7 8 3 7 9