Chi-Square Test(one)
440 likes | 696 Vues
Chapter 8. Chi-Square Test(one). Content. test of fourfold data test of R×C table Multiple comparison of sample rates test of paired fourfold data Fisher probabilities in fourfold data test of goodness of fit. objection

Chi-Square Test(one)
E N D
Presentation Transcript
Chapter 8 Chi-Square Test(one)
Content • test of fourfold data • test of R×C table Multiple comparison of sample rates • test of paired fourfold data • Fisher probabilities in fourfold data • test of goodness of fit
objection • to deduce if there is any discrimination of the ratio or structure ratio between two populations or among more than two populations • multiple comparison of the ratio of multi-samples • to deduce if there is any correlation between two class variables • test of goodness of fit fit for :qualitative data
objective:to judge if there is any discrimination of the rate or structure ratio between two populations (equal to the u-test) demand:the number of individuals from the two samples classified into two categories should be transformed into a fourfold data
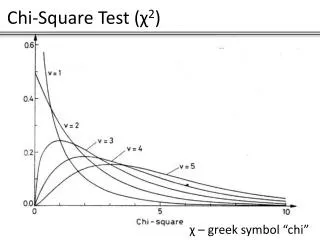
1 The basic idea of test distribution (1)distribution is a continuous distribution: (2) one of the basic characters is that it can be plus to others :
2. The basic idea of test eg 8-1 one hospital want to compare the curative effect of drug A(Omeprazole)and drug B (Ranitidine)in treating the peptic ulcer. They devided 169 patients with peptic ulcer into two groups at random,the results are as follows (table 8-1). According to the data, whether the effective ratio is different?
Table 8-1 the comparison of the healing ratio between two groups in healing peptic ulcer H0: 1 = 2 H1: 1 2
The respected frequencies can be calculated by the following formula: TRC refers to the expected frequencies in Row R and Line C nR refers to the frequency sum of a certain row nC refers to the frequency sum of a certaincolumn
Table 8-1 the comparison of the healing ratio between two groups in healing peptic ulcer
Basic idea :can be showed with the basic formula of test A means actual frequency, while T means theoretical frequency。
Basic idea of 2 test • Given a set of observed frequency distribution A1, A2, A3 … to test whether the data follow certain theory. • If the theory is true, then we will have a set of theoretical frequency distribution: T1, T2, T3 … • Comparing A1, A2, A3 … and T1, T2, T3 … If they are quite different, then the theory might not be true; Otherwise, the theory is acceptable.
the respected frequency is set by the hypothesis ,and by the ratio after merging
the test statistic :the value of reflects the fitness of actual frequency and expected frequency
from formula 8-2,we can see that the value of also depends on the size of (exactly the size of ). is decided by the number of the grids, but not the sample size .
3. The process of hypothesis test (1) establish hypothesis, and set the criteria of the test。 H0:π1=π2 H1:π1≠π2 α=0.05
distribution is a continuous one, while the fourfold table data is dispersible, the valueof calculated by the latter is also dispersible, in order toimprove the continuousness of the statistic distribution ,the continuousness correcting is needed.
the conditions in choosing test formula for the fourfold table data: ,special formula; ,corrected formula; ,Fishier exact probabilities method。
eg 8-2 one doctor want to compare the effect of treatment A (simple chemotherapy) and treatment B (complex chemotherapy) in curing Lymphoid tumor,he divided 40 patients with such illness into two groups at random ,the results are in table 8-3, whether the remission rateof the two treatments are the same ?
in this case, n=40, 1<T11<5,so the corrected formula can be used ,through the critical value table of ,we can find that 。According to the test level 0.05, can’t be rejected ,so we can’t say that the remission ratios of the two treatment are different.
If not corrected ,then the conclusion is on the contrary
Section 2 -test of paired fourfold table
Example 8-5 Table 8-7 the result of the two testing methods
a, d are the agreement of the two methodsb, c are not agreement of the two methods Statistic:
Section 3 Chi square test for R×C table
R×C table ① multiple rate comparing,R ×2 table; ② two constituent ratio comparing, 2×C table ③ multiple constituent ratio comparing, R ×C table
一、多个样本率的比较 eg8-3 table 8-5 the cure rates of three treatments for chronic bronchitis
Table 8-6 the blood type distribution between children acute leukemiapatients and adults acute leukemia eg8-4
Caution: (1) Either 22 table or RC table are all called contingency table. 22 table is a special case of RC table (2) When R>2, “H0 is rejected”only means there is difference among some groups. Does not necessary mean that all the groups are different. (3) The 2 test requires large sample, By experience, • The theoretical frequencies should be greater than 5 in more than 4/5 cells; • The theoretical frequency in any cell should be greater than 1. Otherwise, we can not use chi-square test directly.
If the above requirements are violated, what should we do?(1) Increase the sample size.(2) Re-organize the categories, Pool some categories, or Cancel some categories