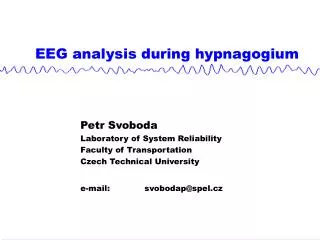
EEG Scalp Potential Analysis During RSVP Tasks: Insights from Advanced Neurotechnology
160 likes | 296 Vues
This study, conducted by Kaushik Majumdar at the Indian Statistical Institute, Bangalore, in collaboration with Robert M. Frank from the University of Oregon and funded by DARPA in 2006, explores scalp EEG separation during Rapid Serial Visual Presentation (RSVP) tasks. Using a 256-channel geodesic sensor network, gray-scale satellite images are presented at a rate of 3 images per second, focusing on target objects such as tanks, trucks, and boats. This research contributes to the understanding of neural responses to interesting versus non-interesting visual stimuli and employs advanced statistical methods for analysis.

EEG Scalp Potential Analysis During RSVP Tasks: Insights from Advanced Neurotechnology
E N D
Presentation Transcript
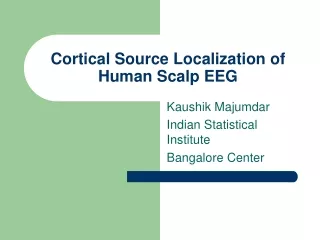
Scalp EEG Separation During RSVP Tasks Kaushik Majumdar Indian Statistical Institute Bangalore Center Done with Robert M. Frank in EGI & University of Oregon in 2006
Neurotechnology for Intelligent Analysts • Funded by DARPA of USA in 2006. • 8 teams involved.
The RSVP Task • Grey scale satellite images were presented at 3/s rate. • # interesting object : # non-interesting objects ≈ 1 : 3. • 256 channel geodesic sensor net of the EGI.
Target Objects • Tank • Truck • Boat
Scalp Potential Parra et al., NeuroImage 28 : 328 – 341, 2005.
Weighted Average EEG Parra et al., NeuroImage 28 : 328 – 341, 2005.
Raster Plot of Two Channels Parra et al., NeuroImage 28 : 328 – 341, 2005.
FP1 Channel of a Subject Huang et al., http://www.bme.ogi.edu/~huangca/papers/C8.pdf
FP1 in 10 – 20 System http://en.wikipedia.org/wiki/10-20_system_(EEG)
ERP Scalp Image of FP1 of a Subject Huang et al., http://www.bme.ogi.edu/~huangca/papers/C8.pdf
Logistic Regression Parra et al., NeuroImage 28 : 328 – 341, 2005.
THANK YOU Slides available at http://www.isibang.ac.in/~kaushik/ISSR-2010.ppt