
Uploaded by
arissa
22 SLIDES
408 VUES
220LIKES
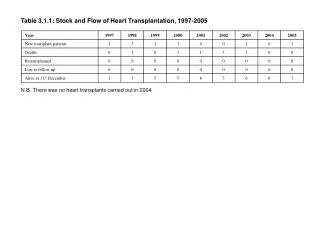
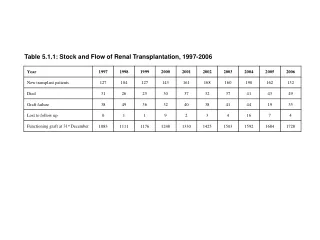
Understanding Stock and Flow Dynamics: Key Figures and Insights
DESCRIPTION
This chapter explores the concepts of stock and flow through a series of figures illustrating various states and transitions across different Australian regions, including New South Wales, Queensland, and Victoria. Key visuals (Figures 1.3 to 1.14) highlight the relationships and changes in stock (resources) and flow (movements), offering insights into regional dynamics. These figures serve to deepen the understanding of how stocks accumulate over time and how flows impact various sectors within Australia.
Download
1 / 22
Télécharger la présentation 
Understanding Stock and Flow Dynamics: Key Figures and Insights
An Image/Link below is provided (as is) to download presentation
Download Policy: Content on the Website is provided to you AS IS for your information and personal use and may not be sold / licensed / shared on other websites without getting consent from its author.
Content is provided to you AS IS for your information and personal use only.
Download presentation by click this link.
While downloading, if for some reason you are not able to download a presentation, the publisher may have deleted the file from their server.
During download, if you can't get a presentation, the file might be deleted by the publisher.
E N D


More Related