Download
1 / 39
390 likes | 574 Vues
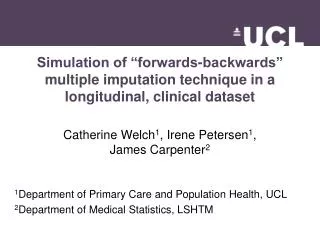
Simulation of “forwards-backwards” multiple imputation technique in a longitudinal, clinical dataset. Catherine Welch 1 , Irene Petersen 1 , James Carpenter 2 1 Department of Primary Care and Population Health, UCL 2 Department of Medical Statistics, LSHTM. Acknowledgements. Steering Group:

E N D
Simulation of “forwards-backwards” multiple imputation technique in a longitudinal, clinical dataset Catherine Welch1, Irene Petersen1, James Carpenter2 1Department of Primary Care and Population Health, UCL 2Department of Medical Statistics, LSHTM
Acknowledgements Steering Group: Irwin Nazareth (UCL) Kate Walters (UCL) Ian White (MRC Biostatistics, Cambridge) Richard Morris (UCL) Louise Marston (UCL) This study was funded by the MRC
Overview • Summary of motivation • “Forwards-backwards” algorithm • Issues that we have encountered
Introduction Most missing data techniques have been mainly designed for cross-sectional data “Forwards-backwards” multiple imputation (MI) algorithm has been developed to impute missing values in longitudinal databases We are in the process of applying this technique to The Health Improvement Network (THIN) primary care database Impute variables associated with incidence of cardiovascular disease (CVD)
Clinical databases Offer many opportunities that would be difficult and expensive to address using standard study design Designed for patient management
The Health Improvement Network (THIN) • Primary care database • Longitudinal records of patients consultation with General Practitioner (GP) or nurse • Data collected since early 90’s • 7 million patients to over 400 practices • Over 40 million person years of follow up • Systematically structured coding (Read codes)
Cardiovascular disease • Clinical databases powerful data source for research e.g. cardiovascular disease • New risk prediction models have caused much debate • NICE recommends further research is required to validate models • Important to have good measures of risk factors and consider missing data
Aims of this project… • Explore the extent of missing data on health indicators (height, weight, blood pressure, cholesterol, smoking status, deprivation, alcohol consumption and ethnicity) • Develop models for imputation of missing data
Survival models • Baseline – at practice registration • Age specific – extract data recorded at a specific age • Non-age specific – risk is constant across all ages • Time varying effect – risk varies across ages 50 60 1 year following registration Registration
Substantive model • Include same variables as Framingham score plus deprivation (Townsend deprivation quintile) and BMI • Poisson model to predict risk of Coronary heart disease • Explanatory variables without missing data: age, sex, left ventricular hypertrophy (LVH), Type II diabetes • With missing data: deprivation, weight, height, total serum cholesterol, high density lipoprotein (HDL) cholesterol, systolic blood pressure and smoking status
Imputation one year following registration • Keep patients registered between 2005-2008 and with practice for at least one year • Exclude patients that have coronary heart disease within the first year • Average of all recorded measurements during the first year included in the analysis • Select 50 practices with least missing data for systolic blood pressure and weight per person • First step: understand structure and extent of missing data
Missing health indicator variables by age 72,759 patients registered to 50 practices between 2005 and 2008
Missing health indicator variables by age 72,759 patients registered to 50 practices between 2005 and 2008
Missing health indicator variables by age 72,759 patients registered to 50 practices between 2005 and 2008
Missing health indicator variables by age 72,759 patients registered to 50 practices between 2005 and 2008
Missing health indicator variables by age 72,759 patients registered to 50 practices between 2005 and 2008
Missing health indicator variables by gender 72,759 patients registered to 50 practices between 2005 and 2008
Problems with ‘ad-hoc’ imputation • ‘Ad hoc’ imputation methods (e.g. complete case analysis, LOCF) result in bias results and potentially incorrect conclusions • Multiple imputation is now established as an alternative method to deal with missing data
Multiple imputation • Assume Missing At Random • Use the relationship between the variables to impute a valid estimate for a missing value • Multiple estimates are combined using Rubins Rules to produce unbiased estimates of coefficients and standard errors • This takes account of uncertainty and variation in the data
Multiple imputation model • All variables in substantive model included in imputation model • Exponential survival model so indicator for CHD and variable for time to event or censoring • MI applied 5 times and results combined
Survival models • Baseline – at practice registration • Age specific – extract data recorded at a specific age • Non-age specific – risk is constant across all ages • Time varying effect – risk varies across ages 50 60 1 year following registration Registration
Considerations when applying MI to longitudinal clinical data Longitudinal and dynamic structure of the data Imputing cross-sectionally is not appropriate Imputations need to produce a logical sequence of values over time Introduction of new quality measures which have improved data recording
“Forwards-backwards” technique Based on the fully conditional specification method of MI Takes into account the dynamic, longitudinal structure of the data Does not require measurements at equally spaced time points Nevalainen et al. Missing values in longitudinal dietary data: A multiple imputation approach based on a fully conditional specification. Statist. Med. 2009; 28:3657–3669
Fully conditional specification (FCS) Based on a flexible selection of univariate imputation distributions Impute one variable at a time using a distribution conditional on all the other variables Procedure iterates over the variables in cycles until assumed convergence Appropriate for non-normal distributions
A graphical illustration of the “forwards-backwards” FSC procedure Among-time iteration Within-time iteration
Apply “forwards-backwards” algorithm to THIN • Select patients registered to 50 THIN practice from 2005 to 2008 • Apply algorithm at all ages • Extract imputations for 11,614 patients aged 60 years old
Preliminary results 11,614 patients aged 60 years old registered to 50 practices between 2005 and 2008
Discussion • Potential to develop this method further • Validation: • using simulations • investigate distributions of longitudinal values • external information • What would be the best way to include outcome in the “forwards-backwards” imputation model? • Interactions
FCS using longitudinal data • Y – fully observed outcome variable • X =(X1, . . . , Xq ) where Xi=(Xi1, . . . , Xip), q repeated measures of p explanatory variables intended to be collected • Xobs and Xmis denote the observed and the missing elements in X • Need the specify a suitable imputation model f (Xmis|Xobs,Y,θ) • The FCS of the imputation model in which imputations are made one variable at a time using a series (j =1, . . . , p) of conditional densities • denoted as • have been imputed k+1 times • have been imputed k times.
FCS using longitudinal data • At time i impute conditional onand the outcome Y. • Rather than condition only on the observed data, we generate appropriate values for from the fully conditional imputation model • One iteration (within-time iteration) runs over the variables j =1, . . . , p. • The inter-correlation among repeatedly measured variables is also of importance, we have a second imputation iteration among the index i (among times).