Download
1 / 8
80 likes | 213 Vues
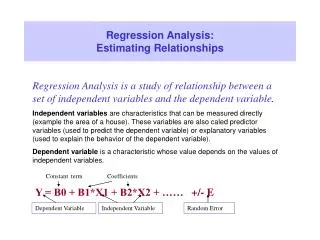
Estimating YOUTUBE Videos’ Viewers Using Regression. Sultan Alkhuzam. WHY?. I want to know what are the factors that predict number of viewers. Channel view . Channel subscribers. Favorite . Number of people who rate the video. Number of people who write comments on a video.

E N D
Estimating YOUTUBE Videos’ Viewers Using Regression Sultan Alkhuzam
WHY? • I want to know what are the factors that predict number of viewers. • Channel view. • Channel subscribers. • Favorite. • Number of people who rate the video. • Number of people who write comments on a video. • Number of people who post a video comment on a video. • Number of people who watch a video though social networks. • Numbers of people who watch a video though a direct link such email or cell phone SMS.
Model Building • Clean the data “60 observation.” • Run All possible regression. • R2 between (.86) and (.82). • Four variables (Social network, video comments, channel view, viral referral) • Three variables End up with R2 (.58) • LINE Assumption: • Normality: violated. • The log of the dependent variable. • Still have issues with skewed data. • Equal Variance: violated.
Model Building • Moderator: • The number of subscribers. • On SOCAL NETWORK. • Center and calculate interaction. • Not significant. • Complete vs. Reduced: • P- value=(.31) • In favor of the reduce model. • Outliers and high influence points: • ± 2 stander deviation and • + 1 based on Cook’s D • 4 observation omitted.
Analysis of the final model: • Bonferroniprocedure: